
Richard uses a trick from Judges Scientific’s playbook to assess local hero Scientific Digital Imaging. Both companies acquire scientific instrument manufacturers using a “buy and build strategy”.
Last month we worked out how to populate Google Maps with SharePad data to find local companies to invest in. Today, we will take the process a stage further, using SharePad to identify and investigate a promising candidate.
Zooming in on local heroes
By zooming into the Atlas, and jotting down the names of all the companies within, say, a 45 minute drive of home we can create a new SharePad portfolio of local companies. I filtered the portfolio using my base filter, which excludes industries I consider unsuitable for long-term investment, and sorted the remaining shares by profit margin, just one of dozens of potentially desirable characteristics we could use to rank the shares. The screenshot shows the best of the bunch, companies headquartered near my home in Cambridge earning decent profit margins of 10% or more.
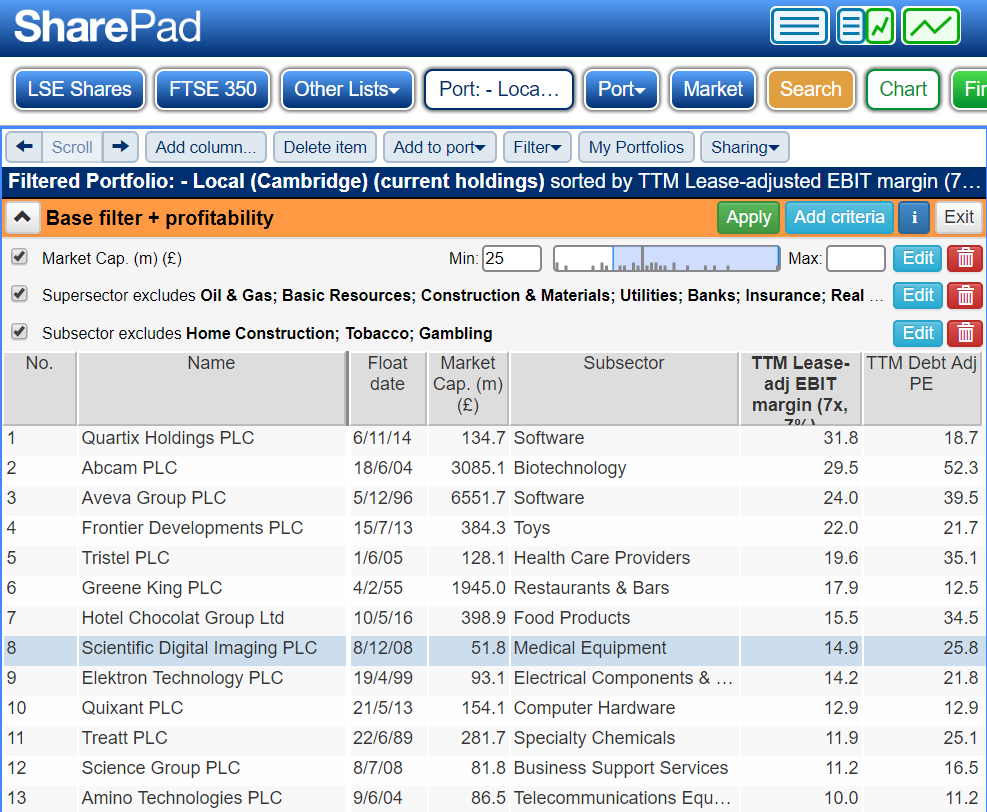
There are good companies higher up the list than the one I chose but I have already investigated some, like Quartix. Others, like Abcam, are valued so highly I am unlikely to be interested in making an investment. Though I consider myself something of an expert in chocolate, and Hotel Chocolat is headquartered nearby, I passed up the opportunity to investigate it because of its debt-adjusted PE of 35.
Using company ‘A’ as a template for company ‘B’
I chose SDI because it makes scientific instruments and so does Judges Scientific, a company I know well. Judges Scientific’s strategy is to buy and operate scientific instrument manufacturers, and about five years ago SDI made acquisition a central element of its strategy.
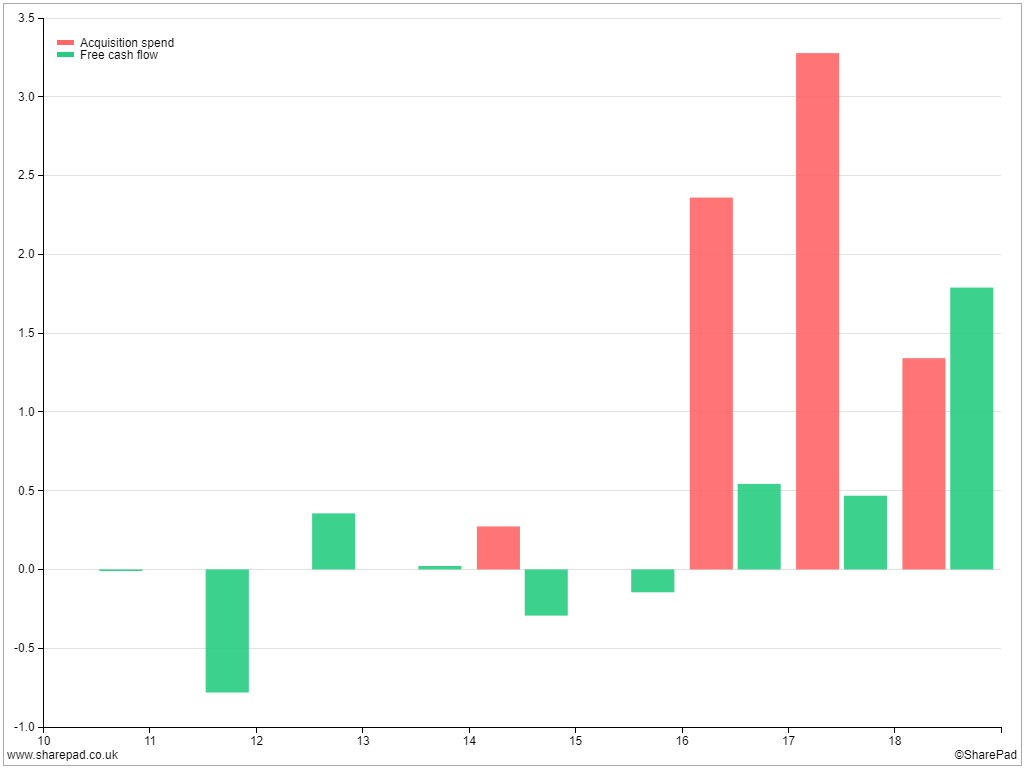
We can see SDI made no acquisitions in the first four years of the current decade (pink bars) and it spent far more cash than it earned on acquisitions in the subsequent five years. We can also see for most of the first six years of the decade SDI lost money in cash terms (green bars). Things have picked up since it started buying other business though…
Both SDI and Judges Scientific dub their strategies “buy and build”, although they are going about both the buying and the building in different ways. Judges Scientific uses debt to finance acquisitions, while hitherto SDI has mostly issued shares, and SDI is buying companies that complement the ones it already owns whereas Judges generally does not care. As long as a business is worth acquiring on its own merits, Judges Scientific is interested, whereas many of SDI’s businesses, broadly focused on imaging and microbiology, supply other SDI businesses. SDI believes the firms it buys are more valuable within SDI, because outside it they are too small to achieve “critical mass”.
Judges has been buying and building for the best part of two decades and has focused its search for acquisitions locally, mostly in the South of the UK. Probably because it is focused on particular technologies SDI is casting its net wider. It has European, and perhaps global aspirations.
Assessing returns at acquisitive companies
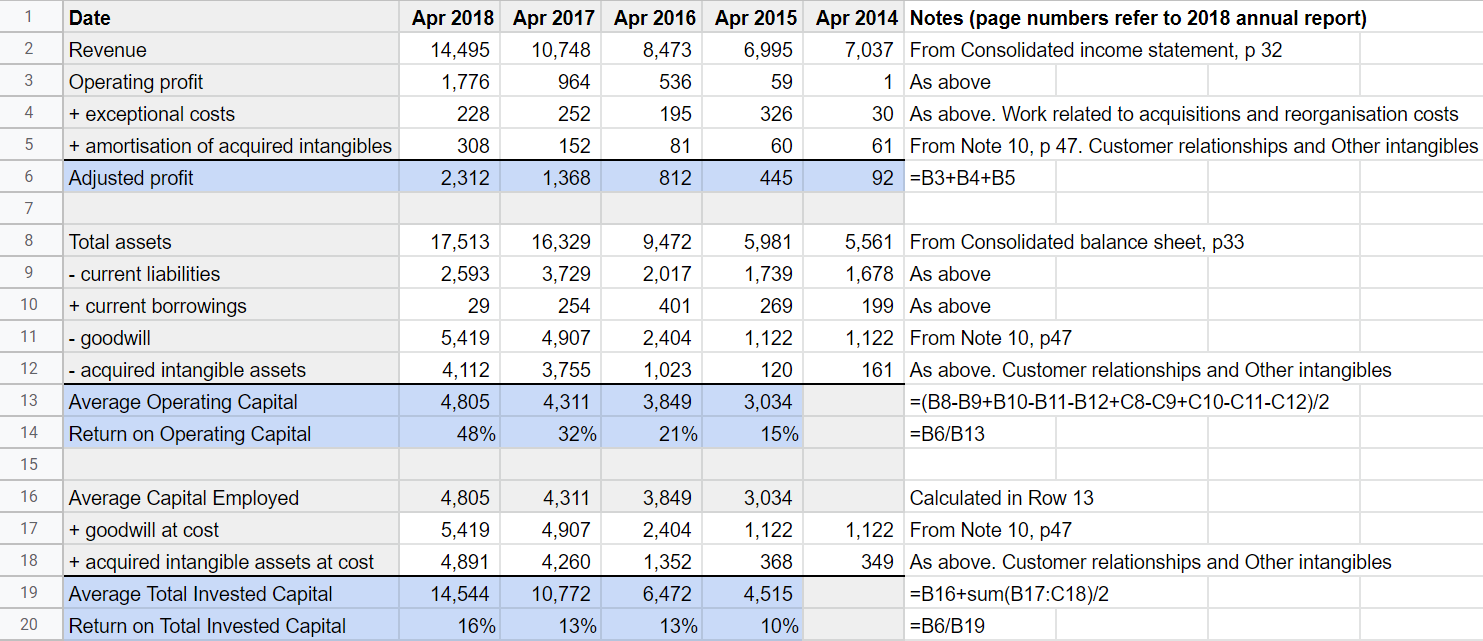
SharePad’s help file tells us how it calculates Return on Capital Employed. It is EBIT (earnings before interest and tax, which is usually the same as operating profit) as a percentage of average capital employed (averaged that is over the current year and the previous year). Capital employed is the money invested in the business to generate a return, however there are numerous ways of calculating it. SharePad takes the value of total assets and deducts the non interest bearing component of current liabilities, usually payables. It does this in a simple, but oblique, way by deducting current liabilities from total assets and then adding back current borrowings (the interest bearing component of current liabilities).
To understand why SharePad does not just use total assets, we have to consider what the non-interest bearing component of current liabilities is. Typically it is a balance sheet item called payables (aka creditors), and the biggest payable is usually suppliers. Companies typically pay suppliers in arrears, which means they hold onto cash that is not strictly theirs for a month or two. This is like an interest free loan and not part of the firm’s investment.
SharePad, tells us SDI’s capital employed in 2018 was £14.9m and the previous year it was £12.9m so the average is £13.9m. EBIT in 2018 was £2m, which means Return on Capital in 2018 was 2/13.9*100=14.4%. To double check this figure in SharePad, click on the Financials tab, then Ratios, and look under the Return Ratios heading. Here it is:
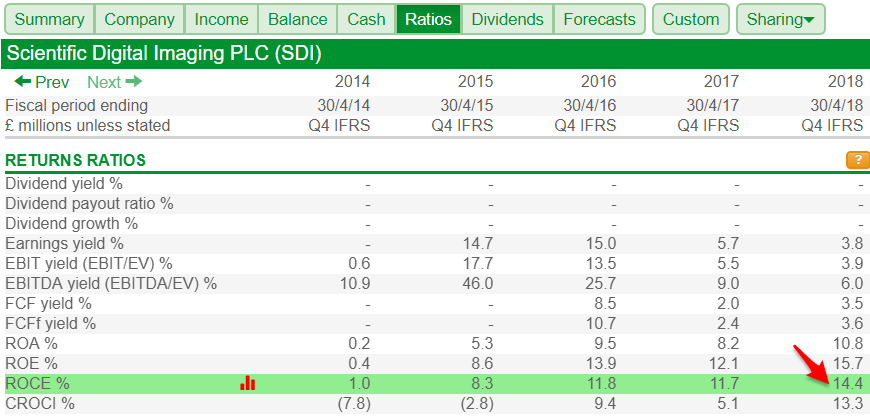
If it can be sustained, 14.4% is a decent enough rate of return, and much better than SDI has achieved in the past, but because SDI is an acquisitive company it may also be misleading.
Acquisitions introduce a huge dose of uncertainty in the accounts in the form of goodwill and acquired intangible assets, which are a big part of the total assets figure and also affect profit because intangible assets are amortised in a similar way to the way physical assets are depreciated.
Acquisition accounting
When a company acquires another company its accountants determine the value of the assets it has bought and add them to its own. If the acquirer paid more than the book value of the physical assets (buildings, vehicles, equipment and so on) then the accountants have to value any intangible assets they can identify and the remainder is goodwill, which is an accounting figment to make sure the books still balance.
Acquired intangible assets and goodwill are sunk costs created only at the time of an acquisition. For example, SDI’s principal acquired intangible asset is the value put on customers at the time of an acquisition (“customer lists”) which is accounted for in Note 10 (headed “Intangible Assets”) of its 2018 annual report. If SDI recruits new customers it will not create an asset called “customer lists”, it will deduct the salaries of salesmen from profit.
In reality, we do not know how much customers are worth or goodwill, so to put all companies on the same footing whether they acquired customers by buying a business or recruited them with salesmen, it is useful to calculate a version of ROCE that excludes goodwill and acquired intangible assets from capital employed entirely and adds back any associated amortisation of the intangible assets to operating profit.
Let us call the subsequent measure Return on Operating Capital to differentiate it from Return on Capital Employed. We want this number to be as big as possible, a big Return on Operating Capital would indicate SDI has valuable intangible assets even if we cannot value them! SDI’s Return on Operating Capital in 2018 was 48%, so on the basis of one year, it is well endowed.
More ways to calculate Return on Capital
In another sense though, acquisitions are everything. We know SDI is going to make more acquisitions so we also need to decide whether the firm has been a good acquirer, or whether the high price it has paid for these companies is hobbling returns.
Help comes in the form of yet another measure of Return on Capital: the Return on Total Invested Capital, a ratio used by Judges Scientific to measure its performance as an acquirer because it uses the cost values of goodwill and intangible assets.
The standard measure of Return on Capital Employed uses book values, adjusted because accountants assume the value of intangible assets will decline as they “used up” in the same way that physical assets are. Intangible assets are amortised and even goodwill can be reduced (“written off” or “impaired”) if companies give up on the investment. The value of acquired intangibles at cost will almost always be higher than the book value after amortisation, and often goodwill will be higher too.
We can find the cost value of acquired intangibles in the same note on intangible assets (Note 10). Having calculated the value of Operating Capital excluding the book value of goodwill and amortisation we just need to add goodwill and acquired intangible assets at cost back to Operating Capital to give Total Invested Capital.
So far so good
SDI’s Return on Total Invested Capital is 16%. As recently as 2014, SDI barely made any profit at all. I must admit SDI’s resurgent profitability surprises me. Often companies overpay when they buy other companies in the expectation “synergies” but the synergies fail to materialise and ROTIC is depressed. The acquisitions appear to have made SDI a better business.
But I am also cautious about SDI because of the short period the company has owned the acquisitions. The best we can say based on the numbers is “so far, so good”.
SDI will publish its results for the year to April 2019 on July 18. The mood music is harmonious. Helped by a full year’s contribution from large acquisitions made in 2018, and a couple of modest acquisitions in the financial year just concluded, SharePad’s forecasts moot a 30% rise in earnings per share:
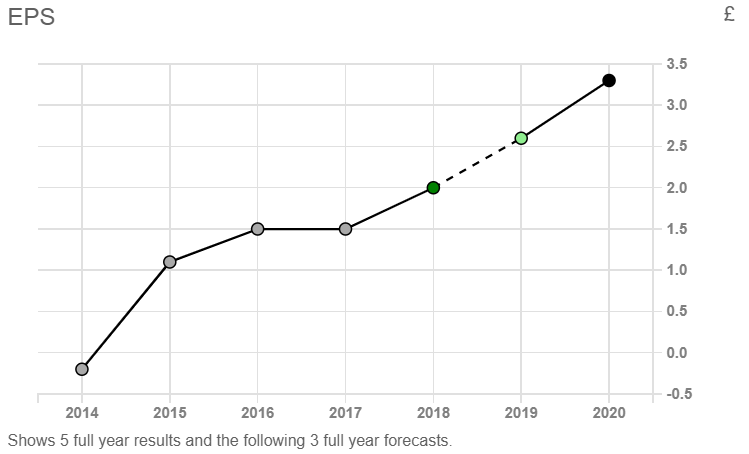
Source: SharePad
I will probably update my spreadsheet when SDI publishes its annual report, and follow it for a while.
If you would like to, you can make a copy of the spreadsheet. It includes some pointers on where to find the information.
Richard Beddard.
Contact Richard Beddard by email: richard@beddard.net or on Twitter: @RichardBeddard.
This article is for educational purposes only. It is not a recommendation to buy or sell shares or other investments. Do your own research before buying or selling any investment or seek professional financial advice.


