
Future PLC is one of the outstanding growth stories of the last five years, but it is also one that eluded Richard. He fesses up to the biases that blinded him to the opportunity, and discusses whether it is still one today…
Today’s company, Future, is one I should have taken a look at a long time ago. For nearly six years now, the publisher’s share price has been delighting or dumbfounding investors depending on whether or not they saw the potential in the business.
In 2016, it was a loss-making publisher of hobbyist tech, gaming, photography and music magazines. Some of these would have been titles I read voraciously a decade or more earlier, when I was hungry for information about my new digital hobbies.
But, by 2016 I had moved on. My expertise had grown, if I needed more knowledge it was readily available on YouTube or in online communities, and I wondered about the future of technology-oriented magazines. They seemed like anachronisms.
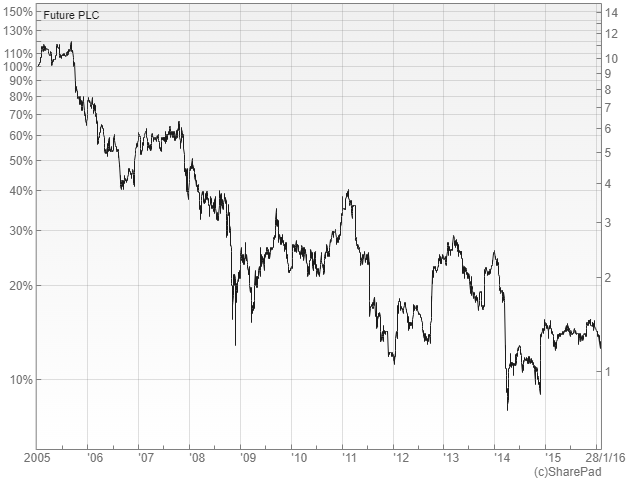
The performance of the business corroborated this view and traders agreed, judging by the performance of Future’s share price up until 2016:
To my shame, as Future turned itself around and then grew rapidly I let my natural scepticism of rapidly growing businesses, particularly when the growth is fuelled by acquisitions, get the better of me.
Future’s growth probably would not last, I told myself, without actually checking the story. The debt will rack up, the company will become more complex and inefficient, growth will run out of steam and ultimately it might get into serious trouble.
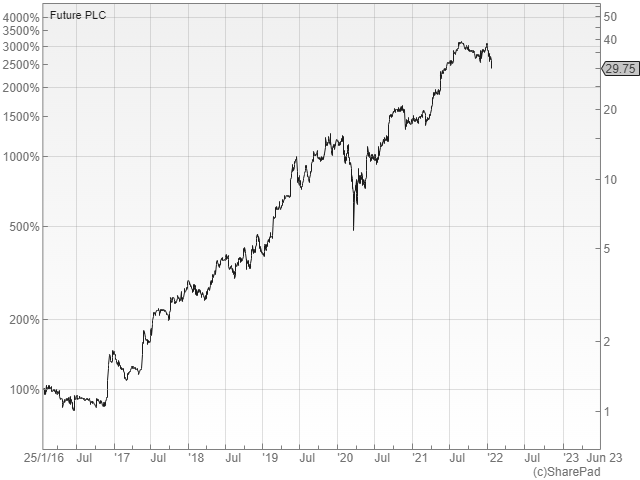
Over the last six years, the share price has grown about 2,500%:
It would be tempting now to assume Future is widely feted that I have missed the boat, which implies we have already reached the destination or that it is not far away. But deciding that without checking the story again, would be to commit the same mistake I made five or six years ago.
As usual there are two aspects to the story, the words and the numbers. My principal concern as always is to establish the company has a coherent strategy and that it is growing profitably.
Future strategy
Future makes it easy to gain an impression of its strategy. Its investor relations page starts with two documents, an investor fact sheet and an introduction to Future. They say much the same thing, in not too many more words than this:
Future is a global platform for specialist media. The platform is built from proprietary software. And the company has a number of ways of making money from it.
Let us unpack that a bit.
There are a number of trigger words in this description, which ought to interest investors. Specialisation is a double edged sword. It restricts the size of a market but that also reduces competition. If a business can serve a lot of specialist niches efficiently then it can be big and also highly profitable.
Efficiency is where the words platform and proprietary technology come in. The company has created and acquired a collection of software services allowing it to create content once, publish it many times, analyse the data generated, and earn money from it through advertising, subscriptions and commissions on products sold through the platform.
This is not only a coherent strategy, but also one that is proven in diverse industries. Take one of my favourite shares, Judges Scientific. In some ways the company could not be more different. It manufactures and sells scientific instruments.
Judges Scientific owns dozens of small manufacturers, like Future owns hundreds of publications. Each of Judges Scientific’s businesses makes specialist equipment, but serves a different market, like each of Future’s titles makes specialist content for people interested in a particular hobby. Both companies have systems to keep tabs on their individual businesses or titles performance and invest in them where they can improve them.
But companies like Judges Scientific and Future are harvesting capital from their businesses, so they can acquire subsidiaries and slot them into their systems.
I think the system component at Future is greater because the platform facilitates the day operations of its subsidiaries.
As the company adds more titles the cost is spread more thinly. Consequently Future should not only be growing, it should be growing more profitable.
Do the numbers match the story?
The two documents contain lots of interesting numbers.
Future has spent £1.4 billion on acquisitions, which is incredible when you think of how small it was not so long ago. It claims half of internet users in the UK visited one of its sites in 2021 and a third of internet users in the US. Over the last two years it has grown online users at a compound annual growth rate of 20% (excluding from acquisitions).
The company also boasts of incredible growth rates.
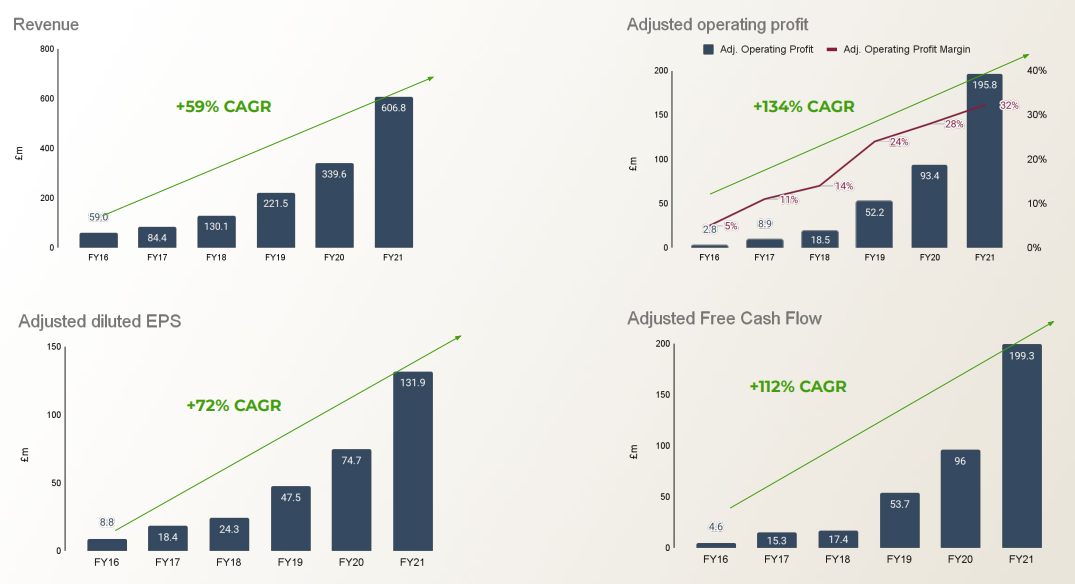
Source: https://www.futureplc.com/investor-relations/
Incredible growth has driven incredible share price gains, but has it come at an incredible cost? To sanity check these figures, I think we need to consider two more numbers that I obsess about:
- Return on Operating Capital, to check whether Future has grown in efficiency as it has added titles to its systems
- Return on Total Invested Capital, to check whether Future is getting a good return on its investment in acquisitions
Return is another word for profit, and the particular version of profit I use in my calculations is earnings before interest, tax and the amortisation of acquired intangible assets. I add back the amortisation of acquired intangible assets because they are historical costs the company in its current form will not incur in future, although it may if it makes more acquisitions.
The definition of capital depends on the context. In judging the efficiency of operations (Return on Operating Capital) we should deduct goodwill and acquired intangible assets from operating capital.
In judging whether the company is a good acquirer we should include goodwill and acquired intangible assets at cost (i.e. before any amortisation) in total invested capital.
I appreciate the last three paragraphs are 90% accounting jargon. The distinction between ROOC and ROTIC is a conceptually tricky aspect of financial analysis, which I have explained in more detail here.
Interpreting the result of those calculations though is relatively straightforward. Because the ROOC calculation ignores acquired intangible assets, which comprise the bulk of Future’s assets, the denominator is very small so we want ROOC to be fancifully high.
Because ROTIC includes all acquired intangible assets at cost it just needs to be sufficiently high to reassure us that the company is not destroying value by paying too much for acquisitions, say more than 10%.
Future’s ROOC and ROTIC show that it is highly profitable, and is growing more so, perhaps confirming that as it gets bigger it is getting more efficient:
| Future | 2016 | 2017 | 2018 | 2019 | 2020 | 2021 |
|---|---|---|---|---|---|---|
| ROOC | -193% | 79% | 143% | 271% | 394% | 309% |
| ROTIC | -6% | 2% | 3% | 5% | 10% | 12% |
Future’s future
The question facing investors now, of course, is what is Future’s future?
It is very early days for the company’s latest and largest acquisitions and shuffling price comparison site GoCompare, acquired a year ago, into its platform is probably a more daunting prospect than magazine titles and websites, which are Future’s meat and drink.
To fund the acquisition of GoCompare and a slew of titles from Dennis last October, Future has used a substantial amount of debt so, as always, there are things to worry about.
Provided there are no missteps though, the company could use its prodigious cash flow to repay the debt in a few years.
At the time of the preliminary results, it was very happy with the integration of GoCompare, and by the time you read this, it will have updated shareholders again in a webinar (broadcast on Tuesday and available on video thereafter).
Richard Beddard
Contact Richard Beddard by email: richard@beddard.net or on Twitter: @RichardBeddard
This article is for educational purposes only. It is not a recommendation to buy or sell shares or other investments. Do your own research before buying or selling any investment or seek professional financial advice.


On 3 Feb, FUTR fell 9.74% despite a reasonably balanced statement that it is “trading in line with the expectations”.
The Chief Exec dipped in with not insignificant £233k of personal money traded on market.
The trades list for 3 Feb gives no real clues with many trades falling outside of the published trading range.
Why did it collapse?
Hi Chris, I am afraid interpreting price movements is not something I attempt. 3 Feb was Future’s AGM though so perhaps it is related to that (there was a big vote against the company’s remuneration policy, which has a number of eye-brow raising components to it and is definitely something I would consider quite carefully if I were to pursue my interest in Future further). The company issued a trading update – it seemed to be quite benign.
Hi Chris – Why did it collapse?
I’m a professional Private Trader since 2009 and can offer my thoughts – Why do markets top out and then reverse on a dime? The answer is because they have to, it has nothing to do with Fundamentals or any of the spouted reasons rife in this game.
If you take every major turning point in a share or any market for that matter – it will form geometrical ratios and shapes which can be confirmed and verified by the maths – This is in HINDSIGHT and it is very hard to predict in advance – but it can be done
Take the SP500 Index – the 2007-2009 crash – that came with 2 points of a perfect ratio equivalent of moving across the diagonal of 2 adjacent squares – this is related to the square root of 5 (2.236) – it also fell 57.69% which is extremely close to perfection of 57.7% from the high which is the EXACT Inverse of 173.2% – 1.732 is the square root of 3 and is the diagonal of a cube
Take the SP500 Index again – why did it top out in early Jan? Well If you take the swing from the low in 2016 up to the Feb 2020 high and times that by 1.902 and project it from the 2016 low, the market topped out within 1 point of perfection
1.902 or 190.2% in geometry is the diagonal of a golden rectangle
The markets move to sacred geometrical ratios – both expansion and contraction – Its why sometimes a market will stop dead on a Fibonacci ratio of 38.2%, 61.8%, 78.6%, 88.6% and other times it will stop dead on 50%, 57.7%, 70.7% etc – these are geometrical ratios less than 1 that relate to the Square, the Cube and other geometrical shapes
although you never know for certain what ratio a market will work to, at key times it provides you with amazing predictive qualities – The FTSE100 Index has been reversing within points of the 70.7% retracement ratio of late (70.7% is the Inverse of 1.4142 which is the square root of 2 and also the diagonal of a square)
Now all this would be random nonsense, but in the space of a few examples and this next one, I’m showing levels outside the probability of randomness
The SP500 Feb 2020 plunge – why did it stop dead where it did? Well not only did we have a major Time Cycle (I called the exact Time Cycle date years prior and have the evidence to prove it) arrive, the market fell by 35.41%
35,41% what’s that? Well if you expand the Square root of 2 (1.414) by doubling it you arrive at 2.828 – This is expanding the diagonal of a square harmonically – well 35.4% is the Inverse of that 2.828 ratio
Markets aren’t doing what people think they are – which is why experts try to provide explanations or shy away providing reasons because they don’t know and can make decent returns from hanging to the coat tails of an ever expanding and rising market
WD Gann back in the 1920s provided us with the blueprint of what markets were doing – very few people have followed through on his work since
Hocus Pocus Technical Analysis all makes sense once you understand and see it through the eyes of geometrical glasses
To name but a few – 1907, 1933, 1974, 1987, 2003 – ALL fell and stopped DEAD within points of key geometrical % levels – which are all provable by mathematics that can’t twist truths or lie
Thanks Richard, that explains why I spotted Future’s name on MoneyWeek’s footer instead of the usual Dennis somethingorother.
I hold MoneySuperMarket so it’s Interesting to see that Future acquired GoCompare. That seems like a completely different kettle of fish to a magazine like MoneyWeek or whatever else Future publishes. I guess there are economies of scale if it can move everything onto a single tech platform, and if it that platform can crunch data for comparisons in the same way as it might do ad tracking or whatever for magazines. Plus email marketing etc.
Seems like an odd fit but perhaps they can make a success of it (hopefully not since I’m invested in one of GoCompare’s main competitors!)
Hi John, when the acquisition happened I thought it was a stretch too but it is interesting to see how these content platforms are developing (see also the New York Times, which is acquiring all sorts – latterly Wordle!). The more people coming to the platform and the more opportunities to part them from their money while they are there, the better. Break it down to its bear bones and price comparison is another kind of content and another way of monetising content. By having everything on one platform, I guess it is more than the sum of its parts if you can integrate it in such a way that does not put people off. Because GoCo is a bit different, perhaps the risk is greater, but also the potential reward.