
Oxford Metrics has an illustrious past, and judging by management’s targets it expects to augment it in future. Richard investigates the past, and ponders the future…
I discovered Oxford Metrics while paging through SharePad’s list of the whole market (LSE shares, excluding Investment Trusts) skimming the summary pages of companies that had recently published annual reports.
The company caught my eye because it has been a profitable, cash-generative business unencumbered by debt that has spent little acquiring firms (it has earned more from disposals in recent years).
It also does something interesting.
World leading Vicon
Oxford Metrics’ main business is Vicon. As part of Oxford Instruments*, a pioneering British scientific instrument manufacturer, Vicon launched the first motion capture system in 1979. These systems use bauble-like tracking targets often attached to people like athletes, patients, and performance artists to capture and analyse their movements.
Vicon’s management bought the company out from Oxford Instruments and launched Oxford Metrics in 1984. Today it claims a 60% global market share.
Although motion capture is most famous for making animation and video games more realistic, the initial applications were medical and Vicon’s biggest customer segment has traditionally been the life sciences.
Demand from universities and hospitals declined during the pandemic though, while motion capture for video games boomed, and film studios relied more heavily on virtual production requiring them to combine the movements of actors on different sets. Entertainment hurdled life sciences to become Vicon’s biggest customer base by revenue in the year to September 2021.
Engineering is a third significant market, for example NASA used a Vicon motion capture system to track its Mars helicopter in testing:
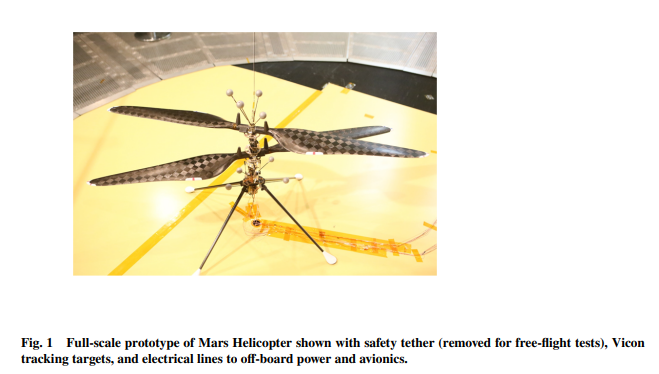
Source: NASA – Mars Helicopter Technology Demonstrator [PDF]
When I came across Oxford Metrics, it had yet to publish results for 2021, and the results for the year to September 2020 were not impressive. According to SharePad ROCE (excluding intangible assets) was just 7%, down from 20% a year earlier. It improved to 13% in the full year to 2021.
Notta lotta profit from Yotta
At this point, I might have moved on, Vicon appears to have a dominant market share but in recent years its profitability has not reflected that. Then I noticed the group’s profit was diminished significantly by the other business Oxford Metrics owns: Yotta, which was responsible for 25% of the group’s turnover in 2020:
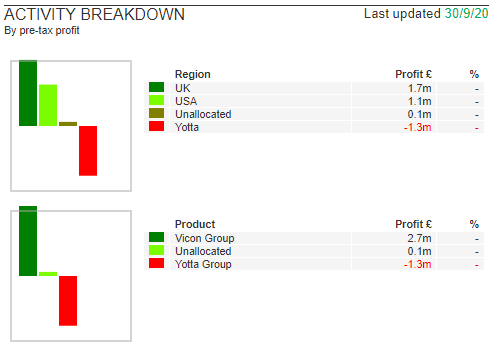
Source: SharePad > Financials > Company
In 2020, Yotta lost £1.3 million compared to Vicon’s positive contribution of £2.7m, so perhaps Vicon is a great business attached to something less attractive. If Oxford Metrics knows how to run one business well, maybe it can turn the other around. Failing that just disposing of Yotta might improve Oxford Metrics.
Unlike Vicon, which is mostly about hardware, Yotta is mostly about software although it was not always that way. Yotta was spun out of Vicon and its initial business model was to map roads and their assets (like streetlights) for local authorities using cameras on vans. However in 2016 it changed tack by focusing on the software it had developed to manage the data it had been capturing. In 2018 it sold off the surveying business.
Secrets in the segments
Let us see whether Yotta has ever made any money and how Vicon has performed over the long-term by taking the data from the segmental report, which can be found in the notes of the annual report, and charting it.
First up, Vicon:
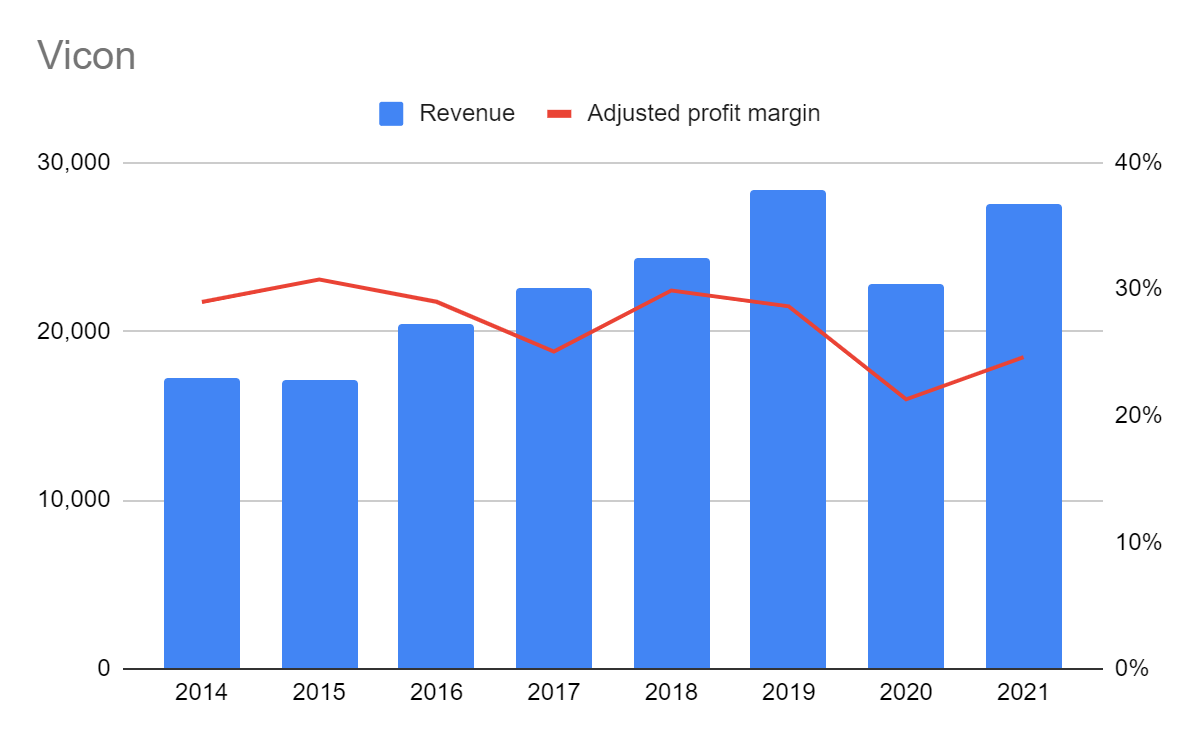
In the five years before the pandemic, Vicon was growing turnover (blue bars) well enough at a Compound Annual Growth rate of 11% and profit margins (red line) were reasonably stable and very healthy at about 30%.
During the two pandemic years to September 2021, growth has stalled and margins have decreased slightly. It seems plausible there is nothing fundamentally wrong, and the business is recovering as the impact of the pandemic recedes.
Yotta managed to grow revenue and return to profitability in 2021:
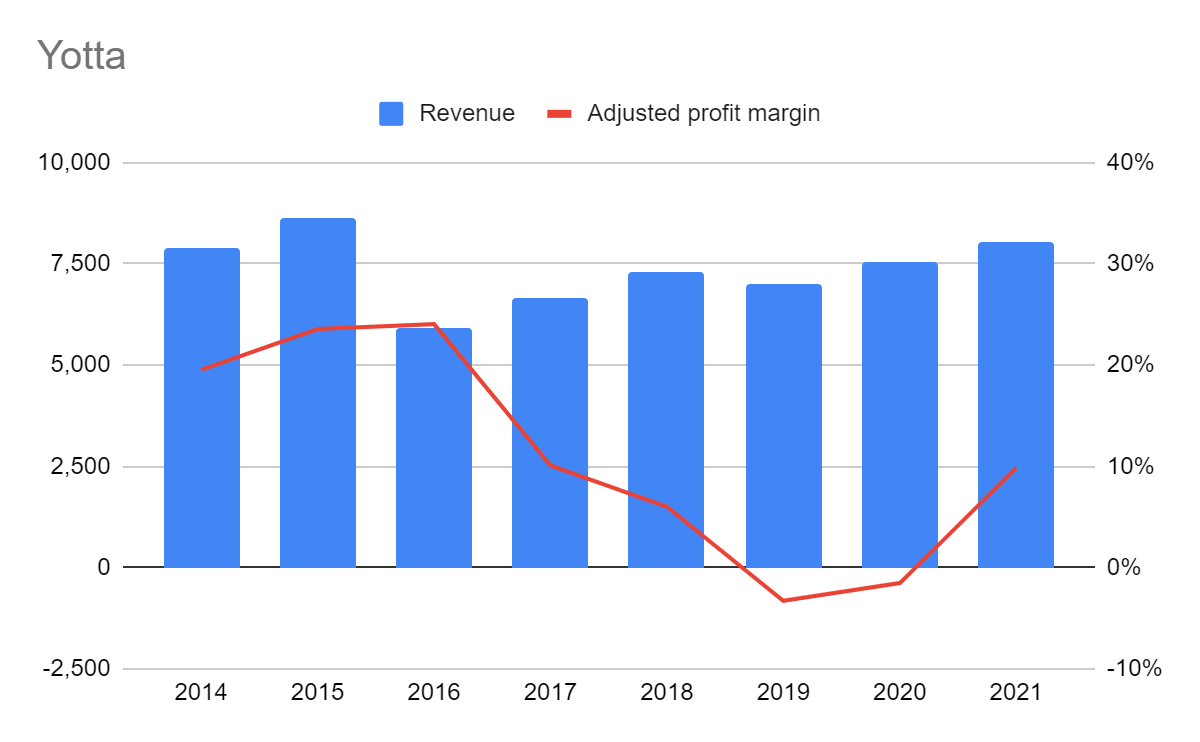
The dip in revenue in 2016 is because Yotta was changing then. The company was preparing to dispose of its surveying business so it did not include that part of its turnover in the results. The decline in revenue and profit between these two years is mostly a result of this accounting and not a decline in trading. Once the disposal was completed of course, it no longer contributed to revenue and profit.
In 2017, Yotta launched a new product, Alloy. This cloud-based software could easily be repurposed for any market, in the UK and abroad, and for any organization dealing with large amounts of infrastructure, for example utility companies like telecoms and energy firms, as well as local authorities. This universal appeal was the key to growth and a return to profitability.
Since then Yotta has grown revenue at a CAGR of 6%, although profit margins collapsed and were negative in 2019 and 2020.
Yotta sells subscriptions and it achieved growth in profit in 2021 by acquiring more revenue than it lost while keeping costs fairly steady. It expects to achieve the same thing in 2022. Although it added revenue in early years this did not feed through to profitability, probably because of the investment required to continue the development of Alloy and establish it in the market.
With the restoration of profit in 2021, though, perhaps Yotta is coming good.
For a glimpse of the future, the company’s presentation last week outlines its strategy:
The company expects to grow turnover 2.5 times in five years while achieving an adjusted profit margin, before tax, of 15%. Turnover was £35.6 million in 2021 so if Oxford Metrics achieves its targets it will turn over £89 million in 2026 and earn £13.35 million profit.
The value of the enterprise, its current market capitalisation less net cash, is £125 million. Were we to invest, we would be paying a portion of that £125 million and the company might return a profit of £13.35 million in 2026, a portion of which would belong to us. That is a decent, albeit speculative, annual return: More than 10% on our investment.
In 2021 though, adjusted profit before tax was £4.82 million. Should the company not grow, our return would be 4%, which is less attractive.
Our decision depends on how likely we think Oxford Metrics is to achieve its targets.
Stockmarket history is littered with unattained targets but the company has one proven asset, Vicon, and another asset, Yotta, that may be maturing into a viable business. It also expects its addressable market to grow from £150 million to £650 million in 2026.
Its strategy is to partner with other companies to supply new markets, and its existing markets should grow as we embrace augmented reality, the collaboration of man and machine that both its subsidiaries facilitate.
Before we get carried away though, one of the ways Oxford Metrics may achieve growth is to buy revenue and profit. The chief executive is mooting acquisitions of up to £70 million, more than half Oxford Metrics’ enterprise value.
There is nothing wrong with this, of course, if Oxford Metrics buys decent businesses that complement its own and does not pay too much.
Too often though, companies do the opposite and destroy value instead of creating it. One of the things that attracted me to Oxford Metrics in the first place was that it had not chosen this route to growth.
Richard Beddard
~
* Oxford Instruments is also an interesting business. I had a first look at it last year and like Oxford Metrics it remains on my watchlist.
Contact Richard Beddard by email: richard@beddard.net or on Twitter: @RichardBeddard
This article is for educational purposes only. It is not a recommendation to buy or sell shares or other investments. Do your own research before buying or selling any investment or seek professional financial advice.


Hi Richard,
I am interested in how you imported the video into your report. I would like to do this. Can you explain it to me please?
Hi Colin, if you go to the video I embedded on YouTube by clicking “Watch on YouTube” at the bottom left hand corner of the video and then click share beneath the video, the first option is “Embed”. This provides the HTML code to include the video in a Web page. I send that code to SharePad with my article and they do the rest when the put the article on the website.
Richard,
Thank you for your reply about embedding a video.
Regards
Colin