

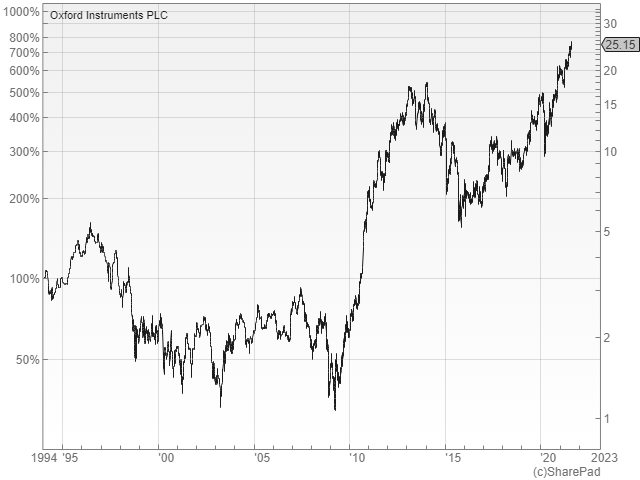
Richard goes deep into Oxford Instruments’ annual reports and SharePad for answers to three questions to establish whether it is a good “pick and shovel play”.
In my last article I explained how I used custom tables to find Oxford Instruments, a highly profitable business that seemed to have lost its way and then found it again.
The numbers, and a strategic shift towards making the most of the businesses it already owns rather than buying more businesses, left me wanting to know more.
How does Oxford Instruments make money?
The instruments it makes, and the services it offers in support, help customers in academia and industry do ground-breaking science and manufacture high tech products.
The instruments, like cameras and microscopes, image, analyse and manipulate materials at the tiniest scales, down to the atomic level.
It manufactures refrigeration equipment capable of making very cold, stable environments required to measure at the atomic scale.
Its products are used in fundamental research, like quantum computing, and in the development of new products like the next generation of batteries, semiconductors, devices, polymers used in medical implants, and vaccines, as well as manufacturing.
It is said of the California Gold Rush that the best way to make money was to supply the picks and shovels. Gold prospecting was risky, and few of the prospectors became rich. They all bought picks and shovels though.
Maybe Oxford Instruments is a pick and shovel play, supplying companies making new technology with the tools they need.
It’s an exciting possibility, but also one that seemed to go off the rails some years ago.
Was its acquisition strategy failing?
Suspicion falls on a failed acquisition strategy because acquisitions peaked with a massive splurge in 2014, then dwindled to zero in 2019, 2020 and 2021. Prior to 2019, Oxford Instruments made at least one acquisition every year this millennium, except in 2004. Something made the business reconsider its strategy.
In the same year, debt used to finance the acquisitions also peaked at nearly 57% of capital employed, and subsequently dwindled and then reversed to a net cash position.
The company experienced a decline in revenue, profit and free cash flow in three of the four years following 2015 (not always the same year).
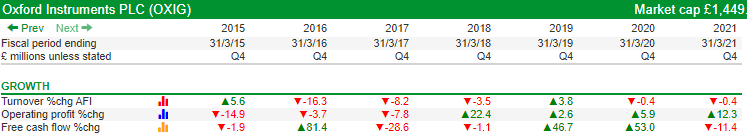
In 2017, there was a £33.8m impairment in the value of the company’s acquired intangible assets. Oxford Instruments wrote off these assets because it no longer believed it would earn an acceptable return from them.
Additionally, while acquisitions remain part of the company’s strategy, they are referred to only once in passing Oxford Instruments 2021 annual report.
To my mind the acid test of whether a company’s acquisition policy is working, is whether it is earning a satisfactory Return on Total Invested Capital (ROTIC).
This is calculated after deducting the amortised and impaired values of goodwill and other acquired intangible assets (their book values) from capital employed and adding back the unamortised and unimpaired cost of acquired intangible assets (their values at cost).
This gives us an indication of whether a company invested wisely. If ROTIC is low, the company may have paid too much for the companies it acquired.
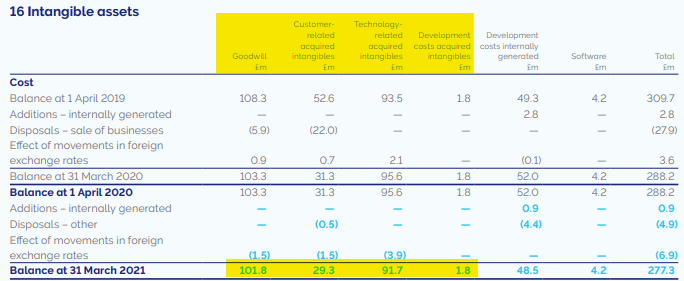
The information we need, the cost price of acquired intangible assets and the book values, is in the notes to the accounts (note 16 in Oxford Instrument’s 2021 annual report), although sometimes the note requires a little interpretation.
Fortunately, Oxford Instruments labels its intangible assets. Here they are: the top part of the table shown here discloses their value listed at cost price (Goodwill is always the result of acquisition):
To calculate ROTIC we need to divide Total Invested Capital into adjusted Earnings Before Interest, Tax and Amortisation of acquired intangible assets (EBITA).
To calculate EBITA we need to add the amortisation of acquired intangible assets to EBIT. Fortunately the amortisation figure is in the same table as the book value and cost of acquired intangible assets.
Here is the ROTIC calculation for Oxford Instruments for every year since 2015:
|
2015 |
2016 |
2017 |
2018 |
2019 |
2020 |
2021 | |
|
ROTIC |
7% |
6% |
8% |
11% |
11% |
14% |
15% |
Returns were a bit iffy immediately after Oxford Instruments’ acquisitions peaked, but since the company stopped adding pricey new acquired assets to the denominator of the ROTIC calculation, they have come good.
While Oxford Instruments may have decided it was paying too much for acquisitions, the main reason it hit pause on the strategy was probably that it had been too greedy. It had bought so many companies it was in danger of breaking the bank.
Indeed, in 2015, the company asked its bankers to relax the covenants on its debt, temporarily increasing the amount it could borrow from 3 times to 3.5 times Earnings Before Interest, Tax, Depreciation, and Amortisation (EBITDA).
As debt levels flirted with the upper levels of what the bank would allow, Oxford Instruments probably realised that more acquisitions were not going to bring about the growth it craved, and it could not afford them anyway.
The figure I mentioned before, peak debt to capital of 57% in 2015, sounds a little high, but we also need to consider the quality of the capital. Because Oxford Instruments had acquired so many companies, its balance sheet was inflated by acquired intangible assets.
Intangible assets are difficult to value, and companies often get it wrong. Oxford Instruments accepted that it had overvalued its acquired intangibles when it wrote some of them off in 2017.
Basing our view of the company’s financial strength on capital that can be so easily revalued is, perhaps, a little cavalier. We can deduct the book value of acquired intangibles (worked out during the ROTIC calculation) from capital employed for a more conservative comparison.
This is what we get when we compare debt (including pension and lease obligations) to tangible capital employed:
|
2015 |
2016 |
2017 |
2018 |
2019 |
2020 |
2021 | |
|
Debt:Cap’l |
170% |
138% |
119% |
48% |
17% |
-95% |
-139% |
In 2015, the company was borrowing 70% more than the capital it required to operate the business, a legacy of its acquisition policy. Had I investigated the company then, I would not have considered it. That level of debt is way outside my comfort zone.
Thanks to the pause in acquisitions by the end of 2021 the situation had reversed, and the company had more spare cash than it had invested in tangible assets.
This probably explains why Oxford Instruments made its first acquisition in more than four years after the year end.
At least it could afford it.
Has Oxford Instruments learned from its mistakes?
The company is in a healthy situation now, but will it return to its profligate ways?
I hope not. Not only did the company pause its acquisition mill until this June, almost all the director’s spiel in this year’s annual report is focused on internal initiatives.
It discusses how the company has improved its relationships with customers through remote support, kept product development on track despite Covid, and strengthened relationships with suppliers.
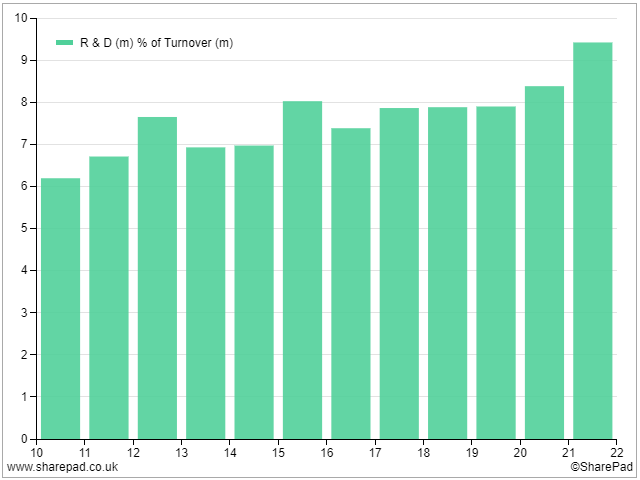
Companies have a choice about how they use their resources, and another indication that Oxford Instruments has become more internally focused comes from its spending on research and development, which has increased steadily from 6% in 2010 to over 9% in 2021:
In many ways 2015 was a pivotal year. It was the year debt peaked, and along with 2016 the nadir of profitability. The company was contracting then, and it was the year the company’s current chief executive was appointed to the board; he took the top job six months later in May 2016.
Ian Barkshire has worked at Oxford Instruments since 1997 in a procession of increasingly senior roles. He saw what went wrong, as well as overseeing what went right, and that may bode well for a more restrained acquisitions policy in future.
~
Contact Richard Beddard by email: richard@beddard.net or on Twitter: @RichardBeddard
This article is for educational purposes only. It is not a recommendation to buy or sell shares or other investments. Do your own research before buying or selling any investment or seek professional financial advice.


Thank you for this article, Richard.
I first bought these Shares in January of 2020 and added to them up to September of 2020 at various prices of between just over £15 and16.50. I took some of the profits earlier in the Summer at just under £25.00 and will hold the rest to see what transpires. The current price seems difficult to sustain in these uncertain times.
Thanks Selwyn, good luck with it! The prices of good quality businesses are something of a concern all round!
Hi Richard
A ratio I like to look at is the total spent on acquisitions over the last decade as a percentage of total net profits over the same period.
This gives me a ballpark “acquisition intensity”. If the ratio is more than 100% (i.e. more spent on acquisitions than was made in profit) then that’s a red flag that needs investigating. The risk is that the acquisitions are so large or numerous that integrating them could disrupt the core business. Or it’s a sign of weak management overreaching to drive unsustainable levels of growth.
A possible exception to this would be companies that are run as a relatively loose federation of autonomous businesses. In those cases, there is little or no integration so acquisition risk tends to be more about debt levels.
Hi John, good to hear from you.
Sounds like a useful comparison. I do something similar. I compare acquisition spend to free cash flow. It’s really easy in SharePad to chart these financials in SharePad or collect them in custom tables. Rather than aggregating I just tend to look at each year. If free cash flow is routinely less than acquisition spend I would have to have a very good reason to investigate the company further as the money has to come from somewhere (debt or share issues) to finance future acquisitions and the returns may not justify the expenditure. If the company is rolling-up acquisitions at a more modest pace, as you say we have to exercise judgement about the complexity of the subsequent organisation.