
Filters are one of the most powerful tools in SharePad, but Richard has been experimenting with another way to discover investment ideas and increase his “market intimacy”.
Traders, of course, have price charts to guide them. Many investors focus on financials, and use filters to find new shares with attractive financial characteristics.
Being a buy-and-hold investor, I am interested in the financials, but they are only part of the story. To hold shares for the long-term I must feel I have had an adequate grasp of the business: how it makes money, how it plans to make more and what could get in the way.
This is the soft stuff: risks, competitive advantages, strategy, and corporate culture. Information about it comes from many sources. To me, it is as important as the financials. In fact the strategy, culture and so on explain the hard numbers and the numbers are evidence they are working.
Filters and FOMO
My aim in this article is not to warn you off filters. If your primary methodology is quantitative they are essential, but mine is only partially quantitative and I wonder if there is another way.
Filters force me into a two stage process: First find shares with good financial characteristics, then investigate the soft stuff. I fear by focusing exclusively on the financials in stage one, I might be overlooking good investments.
Even when we are exclusively interested in financial qualities, we have to be careful designing filters because financial criteria are so precise. A share can meet four out of five criteria comfortably and miss out on another marginally, and it will not qualify.
Also, I like to consider historical trends, and these can be hard to capture in filters.
The benefit of using filters, the ability to almost instantly produce a list of shares that share certain characteristics, comes at a cost: The Fear of Missing Out (FOMO).
It is said that in his early years as an investor Warren Buffett’s primary source was Moody’s Manual, a catalogue of share information running to many thousands of pages, which he read from A to Z.
If you familiarise yourself with every share, however briefly, there is of course, no FOMO. However there is a cost, which is time.
For me, touching every share has become a daily ritual that can last anywhere between 1 minute and an hour depending on how many companies I have to review and how fascinating they are.
A modern day Moody’s Manual
I am using SharePad as a modern day Moody’s Manual. You might think this sounds like a backward step, but I think Mr Moody and Mr Buffett would be impressed with how things have come on since the days of print.
This is my basic setup, which uses the two-panel layout, the first available template when you create a new one from the layout menu:
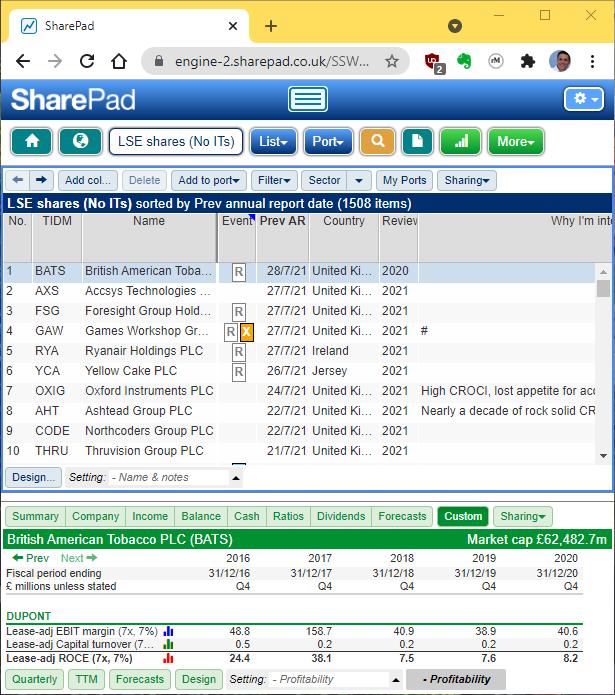
The blue list pane on top shows all shares listed in London excluding Investment Trusts (selected from the menu above it). It tells me:
- Recent and forthcoming events. I am looking out for event code “T”, which means the company is a takeover target. I will not dig deeper if a takeover is likely as I may not be able to hold the shares for long.
- Previous annual report date. I do not go through the list from A to Z, but consider each company just after it has published its annual report (so I can find out more). This column tells me which companies have published their reports. It is sorted so the most recent are at the top. Those are the ones I need to consider now.
In addition I use four note columns (which I have renamed)
- The year I last reviewed the company. This is to keep track of shares I have already considered in the current year. I last reviewed British American Tobacco in 2020 so I need to consider it next (it should not take long!)
- Why I am interested. A few notes based on what I already know and what I have learned from SharePad (see below)
- What the company does (not visible in the screenshot). A quick assessment skimmed from the company’s annual report and website.
- Strategy and culture notes (not visible). Impressions also cribbed hastily from company sources.
This is already sounding laborious, but relatively few companies merit this treatment. Most shares can be ruled out before I start making notes.
Usually I will rule a share out because of the information in my custom tables in the green summary pane or the Single Page Summary, which can be summoned by clicking the page icon in the main SharePad menu.
The Single Page Summary contains some useful non-financial information, a description of the company for example. I am looking for businesses I think I can understand, and it is a bonus if their directors are invested, which the Single Page Summary can also tell me.
Deciding which shares to dwell on
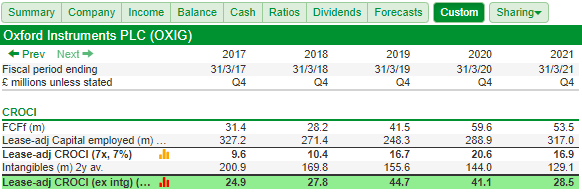
To show you what I am looking for in the custom tables, we can look a bit more closely at Oxford Instruments, which is interesting enough for me to dwell on.
The company’s Cash Return on Capital Invested first attracted me. It has earned terrific cash returns for a long time (longer than I can fit in this article), although there is quite a discrepancy between CROCI excluding intangibles (highlighted in green) and CROCI including intangibles (two rows above):
I can explain that using another of my custom tables, which compares free cash flow to cash spent on acquisitions.
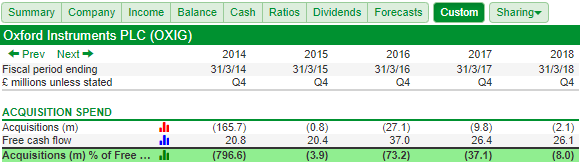
Before 2018, Oxford Instruments was a big spender on acquisitions and then it stopped. In 2014, it spent about eight times as much on acquisitions as it earned in free cash flow.
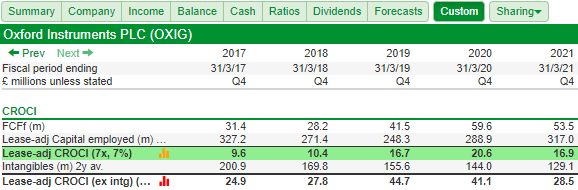
When companies make acquisitions, they must identify the intangible assets they have acquired, a process that inflates their capital employed and makes them look less profitable than they would have been had they just created those assets.
Usually this is an accounting figment, and we can see that since Oxford Instruments has stopped acquiring businesses and amortisation charges have reduced its intangible assets, CROCI including intangible assets has begun to pick up (see the highlighted green row):
I think Oxford Instruments is probably a high return business.
Its newfound conservatism has also had a positive effect on the balance sheet:
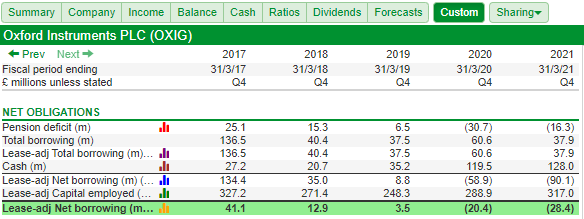
The bottom row of this table shows net borrowing as a percentage of capital employed. In 2017, the company was dependent on external capital for about 40% of its funding. Five years later in March 2021, it had a cash surplus equivalent to nearly 30% of capital employed.
Like many investors I value organic growth, where a company invests in its existing operations, more than acquisitive growth. The risk is that a company pays too much for acquisitions, and we only find this out years later when the returns from the acquisition are insufficient.
Oxford Instruments’ strategy does not eschew acquisitions. In fact, in June, after the company’s year-end, it used some of its spare cash to make its first acquisition for three years. Perhaps huge splurges, though, like the one in 2014 are a thing of the past.
Judging by what the company says about its strategy, Horizon, it is internally focused. The strategic priorities are market intimacy (I presume this means being close to customers), innovation, and product development. It wants its employees to be proud of their work.
This is an interesting setup and Oxford Instruments is joining the list of companies I follow. My biggest challenge may be understanding what it does.
It supplies products and services to help companies with basic scientific research, product development, and manufacturing, which is not at all straightforward. It has capabilities in many high tech areas, semiconductors, nanotechnology and quantum computing. The German acquisition makes nano-analytical microscope systems.
Even if I choose not to dig deeper into Oxford Instruments this year, my notes are in SharePad. When I consider the company again next year, I will have a head start.
To steal from Oxford Instrument’s playbook, I am gradually increasing my market intimacy.
Richard Beddard
~
Contact Richard Beddard by email: richard@beddard.net or on Twitter: @RichardBeddard
This article is for educational purposes only. It is not a recommendation to buy or sell shares or other investments. Do your own research before buying or selling any investment or seek professional financial advice.


