

A big thank you for the very helpful comments left for me following my last blog. It is really encouraging to read members’ experiences, advice and opinions. Also, it’s good to know someone is reading the blog! Thanks to Frank for his good book recommendations. I have ordered two of the books to hopefully start reading over the Xmas break. Although with my A-level mocks coming along in January it might be a while before I finish them.
My Trading System
I am slowly developing what I hope will be my long-term technical system. Obviously, it is all about trial and error and learning as much as I can from my mistakes.
My technical system currently starts with me checking through a watchlist on an overview screen consisting of:
– Three daily point and figure charts
– A daily Ichimoku chart
– A weekly Ichimoku chart
This overview screen is helping me to determine how bullish or bearish a share is looking at a glance. Ideally, I am looking to buy a share to go long when it is looking bullish on all short, medium and longer-term point and figure charts. The Ichimoku is proving great as a quick visual perspective for this too. My overview screen is proving to be a good starting point for me. I can look through a number of companies quite quickly before deciding to look at them in more detail.
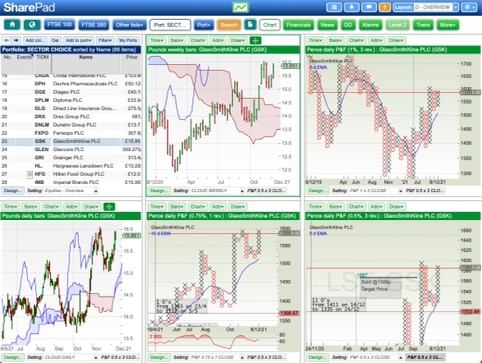
A good example of this overview screen is GSK as shown below.
If a share warrants further investigation I move to my triple screen page to analyse in more detail.
I have recently started to use a single EMA as a baseline, and I look to take buy signals above this EMA and sell signals below it. Although I am always looking for good pullbacks on bullish shares as well. As a rule, this seems to work well and catches trends but irons out some of the whiplash.
At this stage if a company looks technically interesting I will check through SharePad’s fundamental tools such as; free cash flow, dividend discount and forecasts. If the company is still interesting to me I will complete a simple company checklist which is a trading strategy I have compiled. It only takes five minutes to complete so it’s not a waste of time if I don’t purchase the share. However, if I do purchase the share it won’t be a reactive trade as I have my plan in place. The details might need slight modification but the basics would be on hand ready.
SHARES – Bought/Sold/Watching
GSK
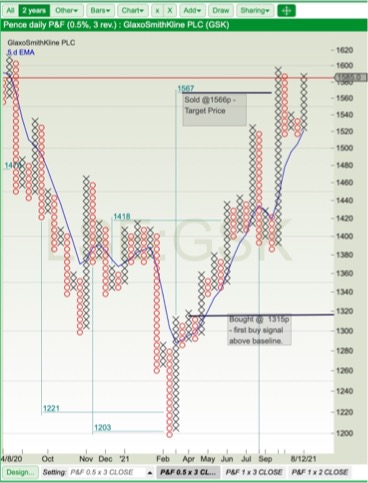
I bought this share at 1315p on its first buy pattern after crossing the 5 EMA baseline. I set a sell order at 1566p which was filled in November. The 0.5 x 3 close chart allowed me to see the new trend reasonably early and the 1 x 3 close chart ironed out the whiplash up to the 1566p target.
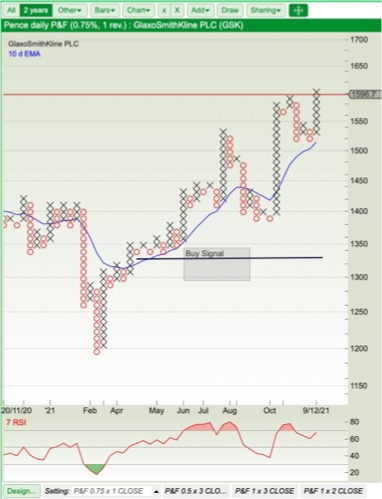
0.75 x 1 Close Chart
Notice with this chart below on GSK that the first buy signal above the 10 EMA baseline at 1328p coincides with the RSI moving above its 50 line.
DRAX GROUP – DRX
I bought Drax at 390.5p in August following a sharp pullback on what was a bullish share. It had a price target of 502p but I decided to run with the share as since adding the 5 EMA to my charts it has made it so much easier to stay in with a bullish trend. I will see how far I can run with Drax until the 1 x 3 close chart shows a sell pattern.
I know I had quite a bit of luck with Drax going up in price quite rapidly. I had bought it potentially for the longer-term as an investment, but it had the boost from a cable fire and energy crisis. It will be interesting to see if the re-rating of this share price holds. In the meantime, I am keeping my eye on it.
SSE
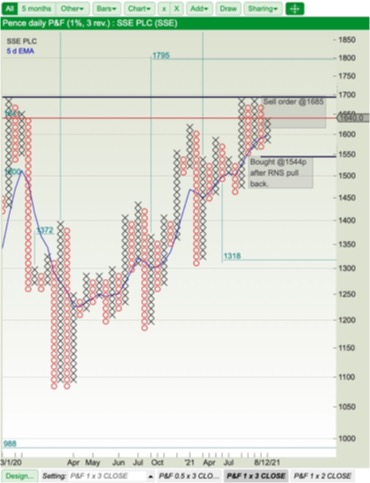
I bought SSE during November after their RNS had been released. The share price dropped to a sub-support line. I couldn’t see anything in the RNS that seemed a major issue so I bought some shares as a potential swing trade at 1544p.
I had checked my overview screen, which was showing the share as bullish on all charts with multiple upward price targets. Luckily I had filled in my company checklist a few days earlier. Even though the charts were showing multiple upward targets, I didn’t like the major resistance line at 1690.5p and I have therefore set my selling order at 1685p.
If SSE breaks through the resistance line and settles above it I will buy again in the future.
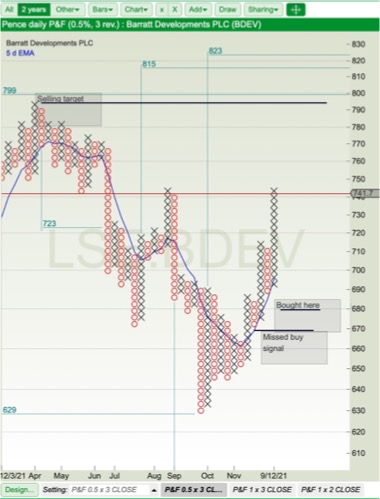
BARRATT DEVELOPEMENTS – BDEV
I bought this at 679p in November. I missed the first buy signal at 669p and bought after the column of O’s and the next X column had started.
The chart had formed a consolidated triangle pattern so I felt the price had to move into a new range to try and find some volume.
I had worked out my risk/reward as follows:
Count target: 793p (potential double top)
Reward: Count target (793p) – Buy price (679p) = 114p
Risk: Buy price (679p) – Stop price (649p) = 30p
Risk/Reward: Reward (114p)/Risk (30p) = Ratio = 3.8:1
I felt this trade was worth making as I was able to use a fairly tight stop.
The share was bullish on all my charts with multiple upward targets on the 1 x 3 close and 0.5 x 3 close charts.
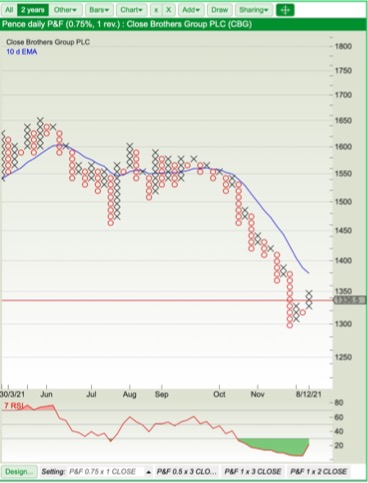
CLOSE BROTHERS – CBG
Close Brothers is a share I have been watching for a while to buy as a swing trade when a buying pattern forms. The share is bullish on the short and medium point and figure charts. The price drop since October has wiped off all upward targets so I will sit tight and wait for the drop to burn out and the new upward trend/targets to form.
I used to think I had to try and buy the absolute bottoms and sell the very top. Point and Figure is convincing me to not think this way, but to think more along the principles of the “S” curve. Hopefully, this may prove to be a more balanced way of trading.
______________
Well, it’s back to school work; music, Christmas concerts, church choir, studying, etc.
Unfortunately, the Student Challenge didn’t run again this year, which was disappointing as I really enjoyed competing against the other schools.
New Year is the beginning of my final two terms in Sixth form, so lots of revising for my A levels over the next few months.
I wish you a very Happy Christmas and a prosperous New Year.
William St John Bacon
Read William’s previous article here and leave your top investing and trading tips for him in the comments section below.
This article is for educational purposes only. It is not a recommendation to buy or sell shares or other investments. Do your own research before buying or selling any investment or seek professional financial advice.


Hi William,
Thanks for another very interesting and thought provoking article.
Good luck with your investment strategy and do keep writing the articles.
All the very best
Richard
Hi Richard,
I’m pleased you are enjoying the articles. Thank you for taking the time to leave a kind comment.
William
William thoroughly enjoyed your three very well written articles. Unlike you, I am at the other end of my life and having retired have taken up a life time interest in shares which SharePad so well serves.
In your overview screen (above) I wonder if it would be possible to provide a better picture to show what it comprises or provide details of each mini-screen. I am not sure whether this is something that you can provide or SharePad.
Wish you every success in your career as either a professional investment manager or as a hobby.
Hi Simon,
Thank you for showing such interest. The overview screen (apologies for the small picture) comprises of the following:
Starting from the top left, the weekly Ichimoku chart with the lagging line showing only.
Top right is the point and figure close 1% x 3 box chart with a 5 EMA
Bottom left is the daily Ichimoku chart with the lagging line showing only.
Next chart right is the point and figure close 0.75% x 1 box chart with a 10 EMA and a RSI set at 7 below it.
Far right is the point and figure close 0.5% x 3 box with a 5 EMA.
Please do let me know if you would like any further info.
I really appreciate your kind comments.
Thank you,
William
Thank you William.
I will replicate your charts in my SharePad.
Very best wishes,
Simon
Thank you William.
I will replicate your charts in my SharePad.
Very best wishes,
Simon
Hi William,
I’m a 100% technical trader – great articles, I wish you all the best on your journey
If you look at the BDEV P/F chart – The swing low in Sept ’21 was followed by a series of inside swings/bars – then broke out of the 4 O’s to rally – basically formed a contracting triangle shape – breakout of those types of formations can be used with a tight stop under the lower part of the triangle and returns of 10-20:1 are not unusual