

I’m back at school and in my last year, studying for my A levels. It has been great having time during the summer break to read some new books.
What I’ve been reading
Tom Dorsey’s – Point & Figure Charting
I started with a book from Tom Dorsey, kindly recommended to me by Michael Taylor in a comment he left. It was certainly well worth reading even if it was only for the last chapter named Portfolio Construction and Management. Mr Dorsey states,”seventy-five to eighty percent of the risk in any particular stock, ETF or fund is the market and the sector”.
Dorsey’s Stock Evaluation Chart (rated in order of importance):
Positive | Negative | Comment | |
|---|---|---|---|
Market | |||
Sector | |||
Sector RS | |||
Trend | |||
Relative Strength | |||
Peer Relative Strength | |||
P&F Pattern | |||
Price Objective | |||
Stop Loss |
His book is heavily into the concepts and importance of market breadth along with relative strength and how they give you a fighting chance of achieving your objectives. He also says (which makes a lot of sense to me as I study for my A levels) “life is a cinch by the inch, hard by the yard”. I thought this was a great metaphor. I will need to read this book again as it contains so much information!
Jeremy Du Plessis – 21st Century Point & Figure
This is a follow-on book from the Definitive Guide to Point & Figure which shows techniques and strategies for point and figure charts. It contains an array of interesting ideas for boosting P&F charts. I am slowly working through some of the methods to see if I can make use of them in the future. This is quite a slow process as there are many ways of working the charts. Finding out what works for me will take some time. So far, I have managed to incorporate into my system a P&F chart where the box size is constructed using a standard deviation formula. I use this as a longer-term chart, and it seems a very helpful insight for determining stock direction for my longer-term portfolio.
Again, this book was well worth the read, but it will take many read-throughs and practice to understand it all. It was a great add-on to my current P&F books.
Sentiment Chart
I decided to set up a VIX chart for sentiment along with an oscillator. I find it easier to flip the chart which makes more sense of the oscillator. I use a line chart to cut down the noise, either on the daily chart as below, or a weekly chart if I want a bigger picture.
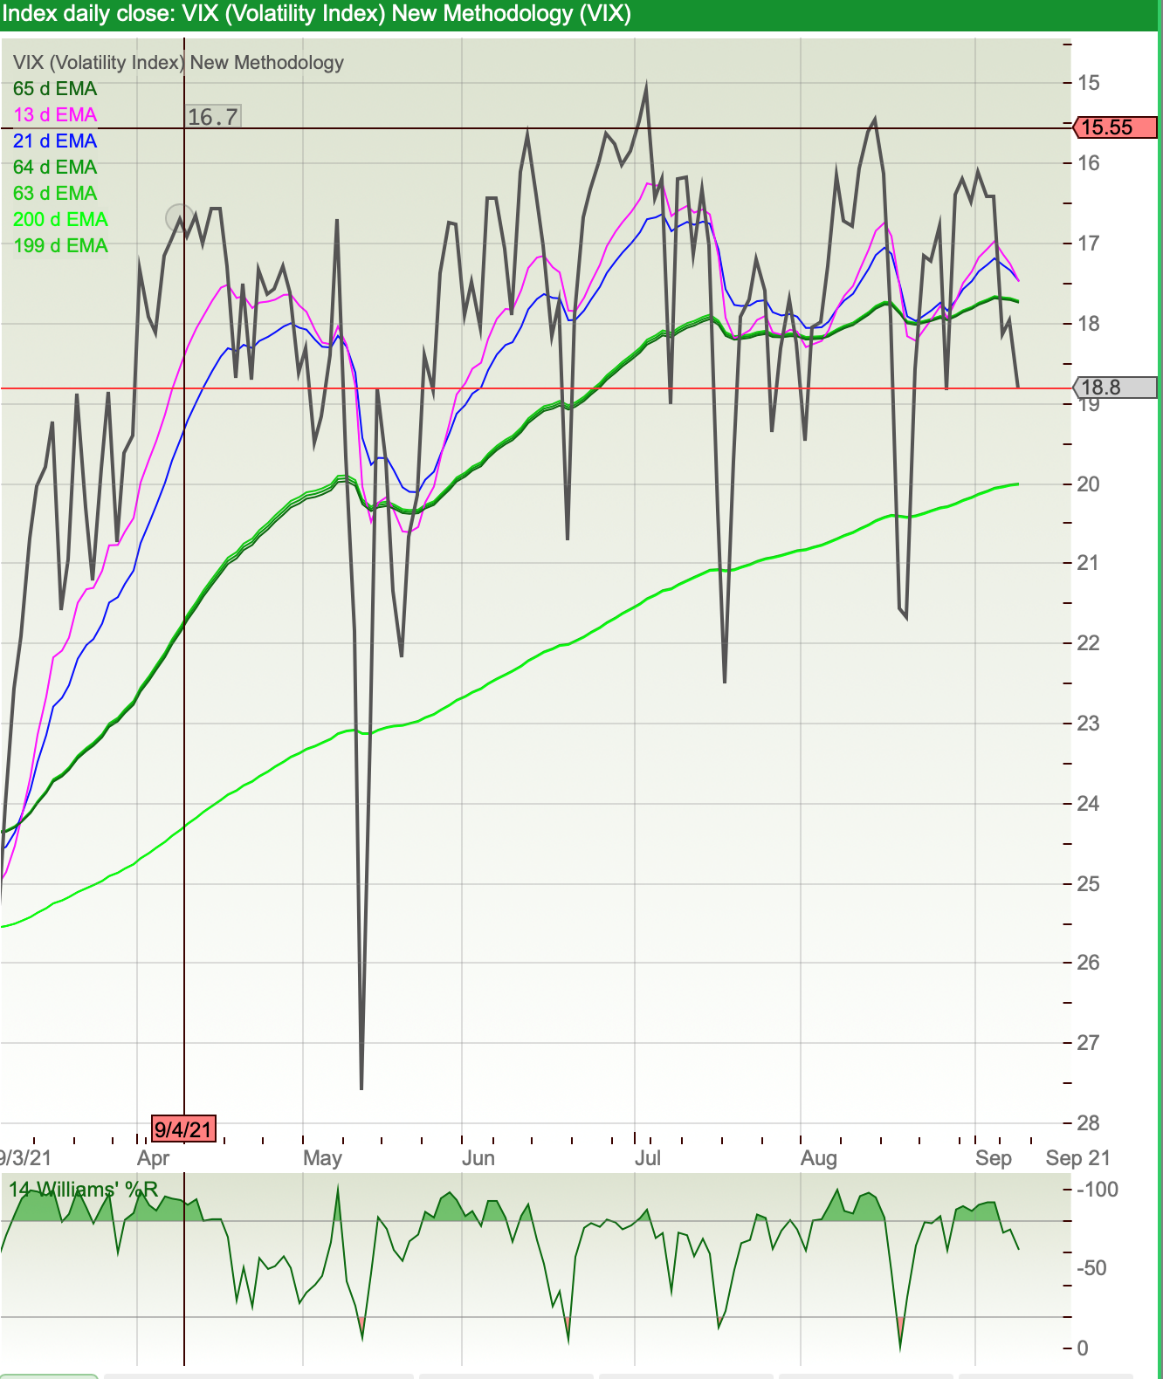
It seemed that if I had purchased any of the shares I was interested in at around any of the points where the oscillator broke through the Williams -20, I would have had a good chance of making a profit or buying a good quality share that may have pulled back with the market drop. So, this is a chart I have added to my technical analysis.
Sector Charts using P&F
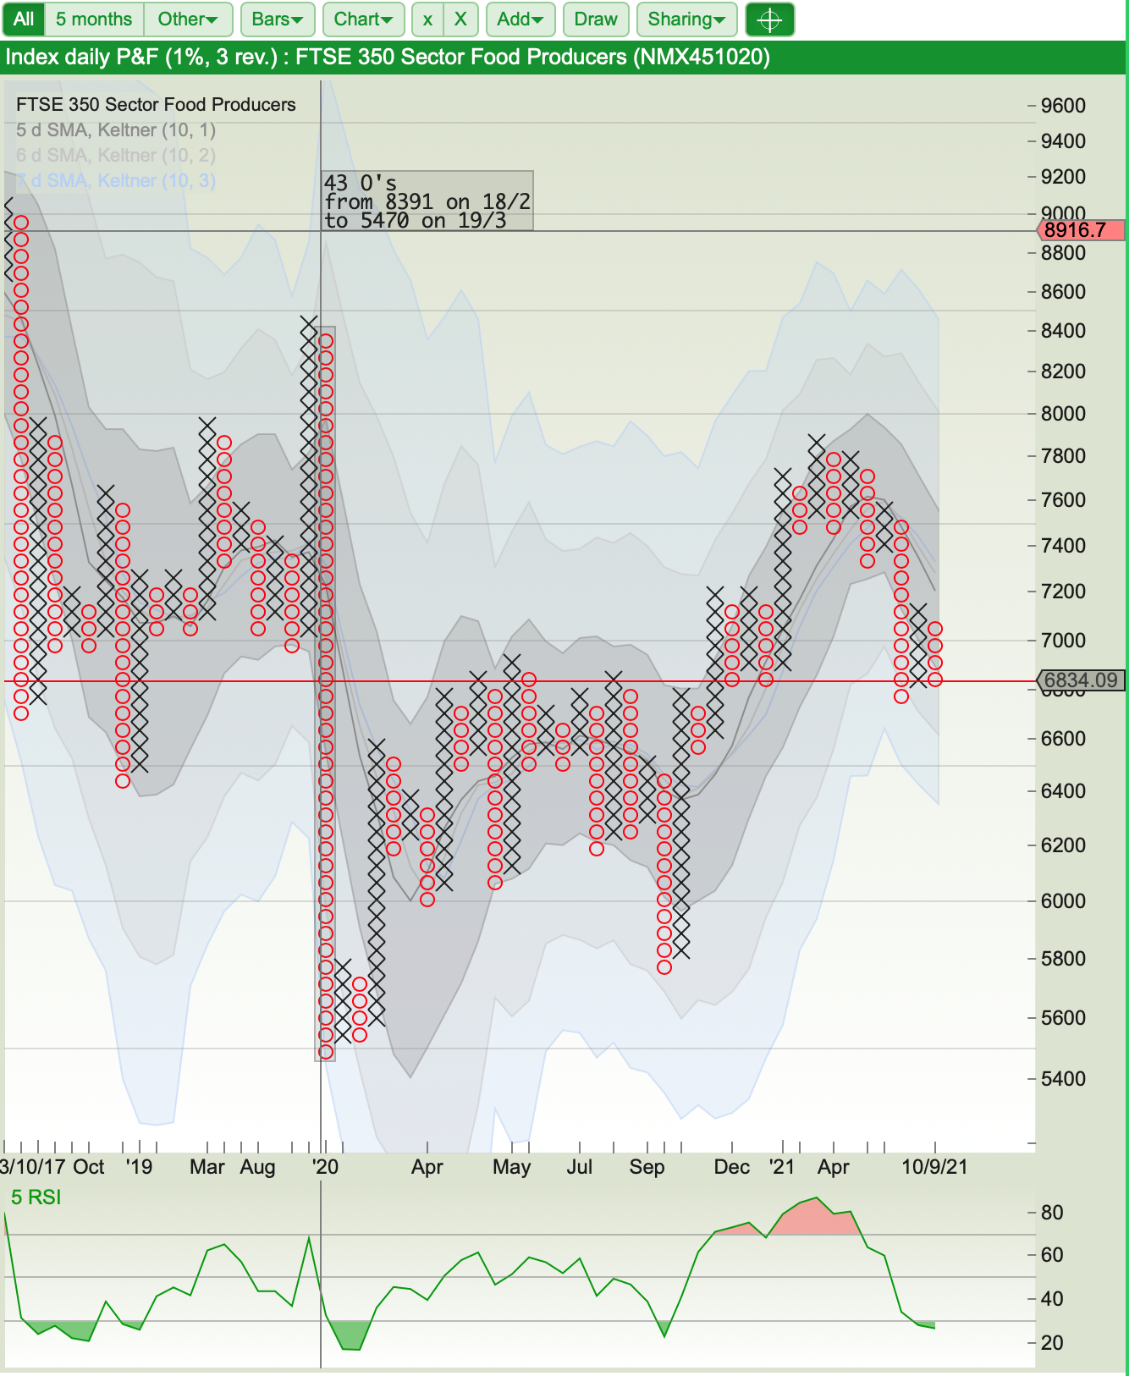
I like looking for potential oversold points on a sector. I use the FTSE 350 sector indices list and filter for an RSI cross below 30. I have found the RSI to be a useful oscillator to use with P&F charts. I look at the P&F chart for the sector (example in chart below). I then click the SharePad Sector button to show companies listed within the sector.
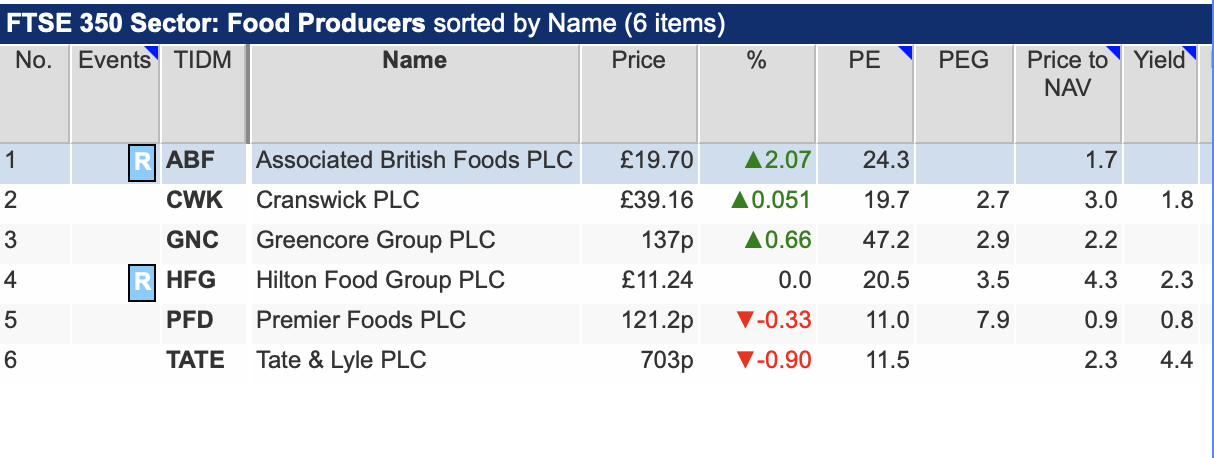
I can now search through the sector list using my chosen P&F chart. As an example, ABF is shown.
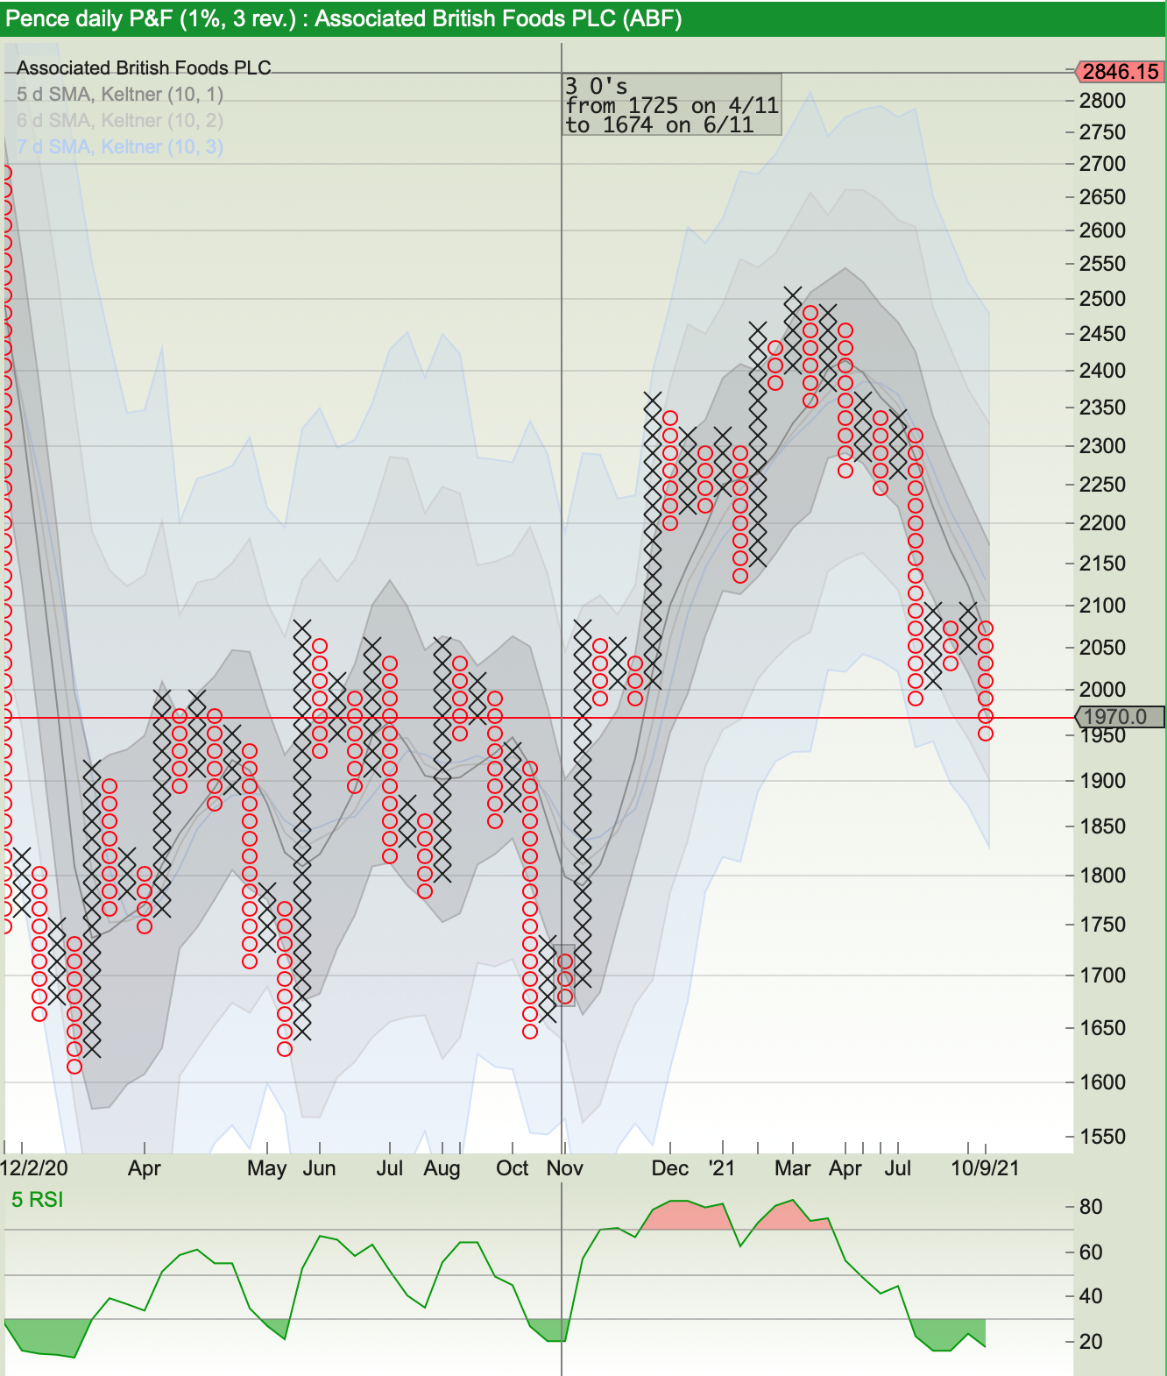
ABF needs further investigation to determine whether it fits into my strategy and is worth buying at some point.
How my shares have performed
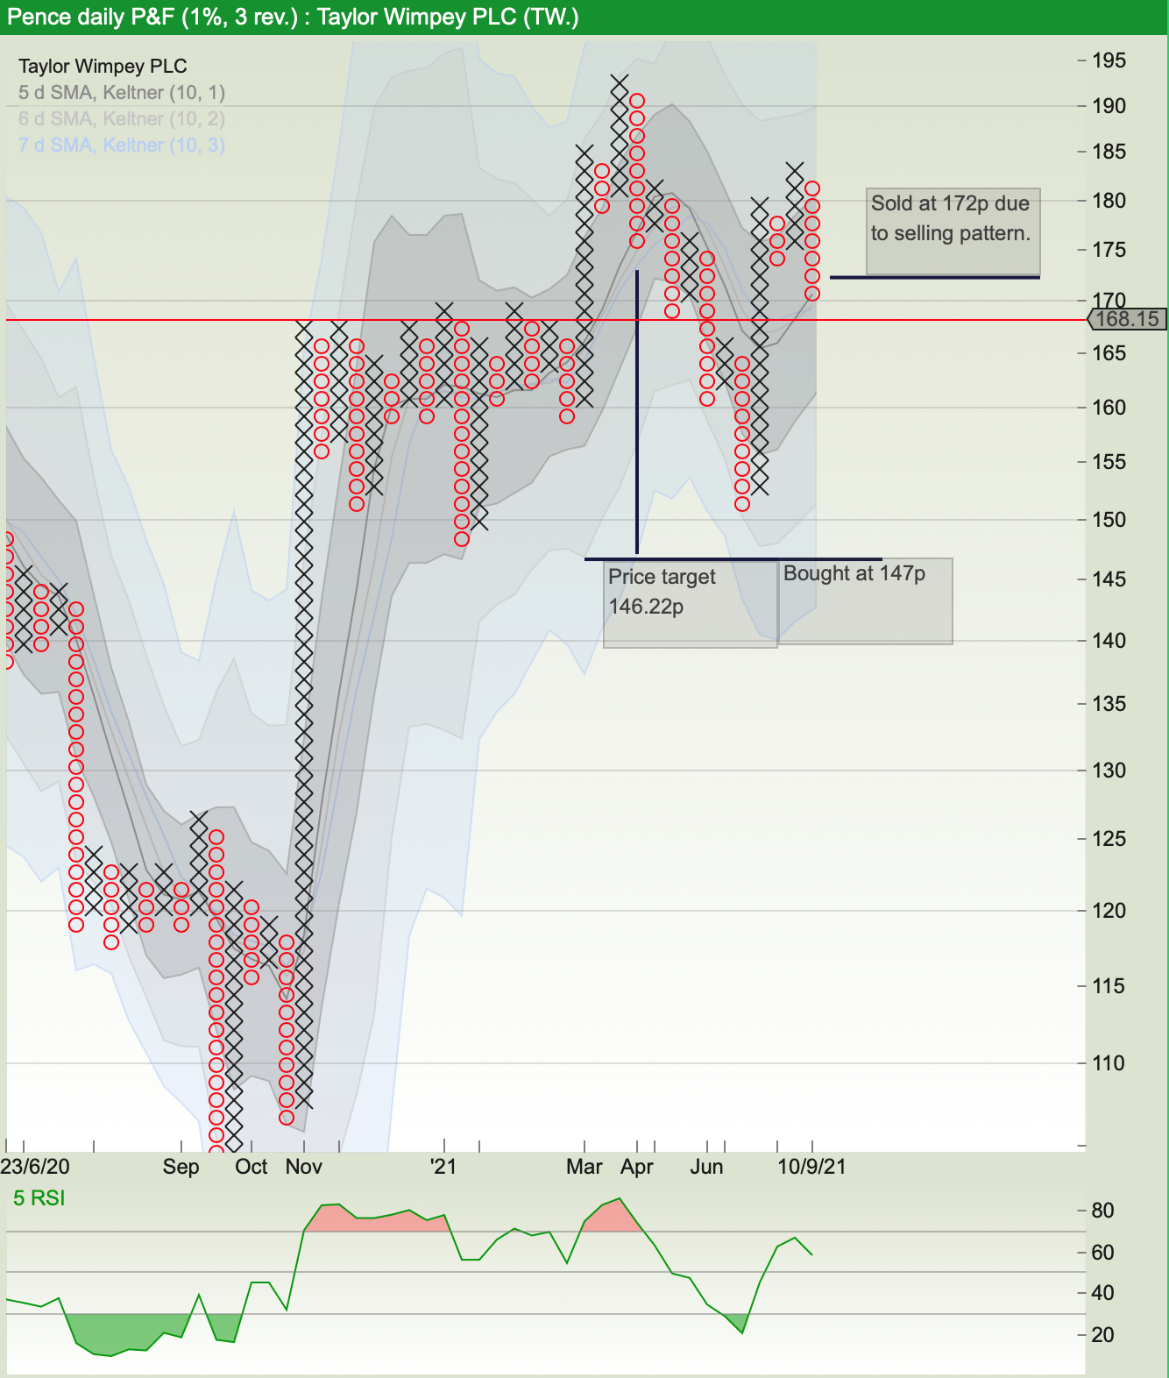
Taylor Wimpey (TW)
I had been keeping an eye on Taylor Wimpey to buy as a swing trade since it developed a selling pattern during April ’21. It finally dropped to 146p, which was in fact its 1% x 3 box price target. I had placed my purchasing limit order set at 147p. I held the share until it developed a selling pattern and sold at 172p. The close chart won’t show all daily movement of course, but I like not seeing too much noise. The sector chart also showed the sector was oversold when I purchased so it helped with my decision making.
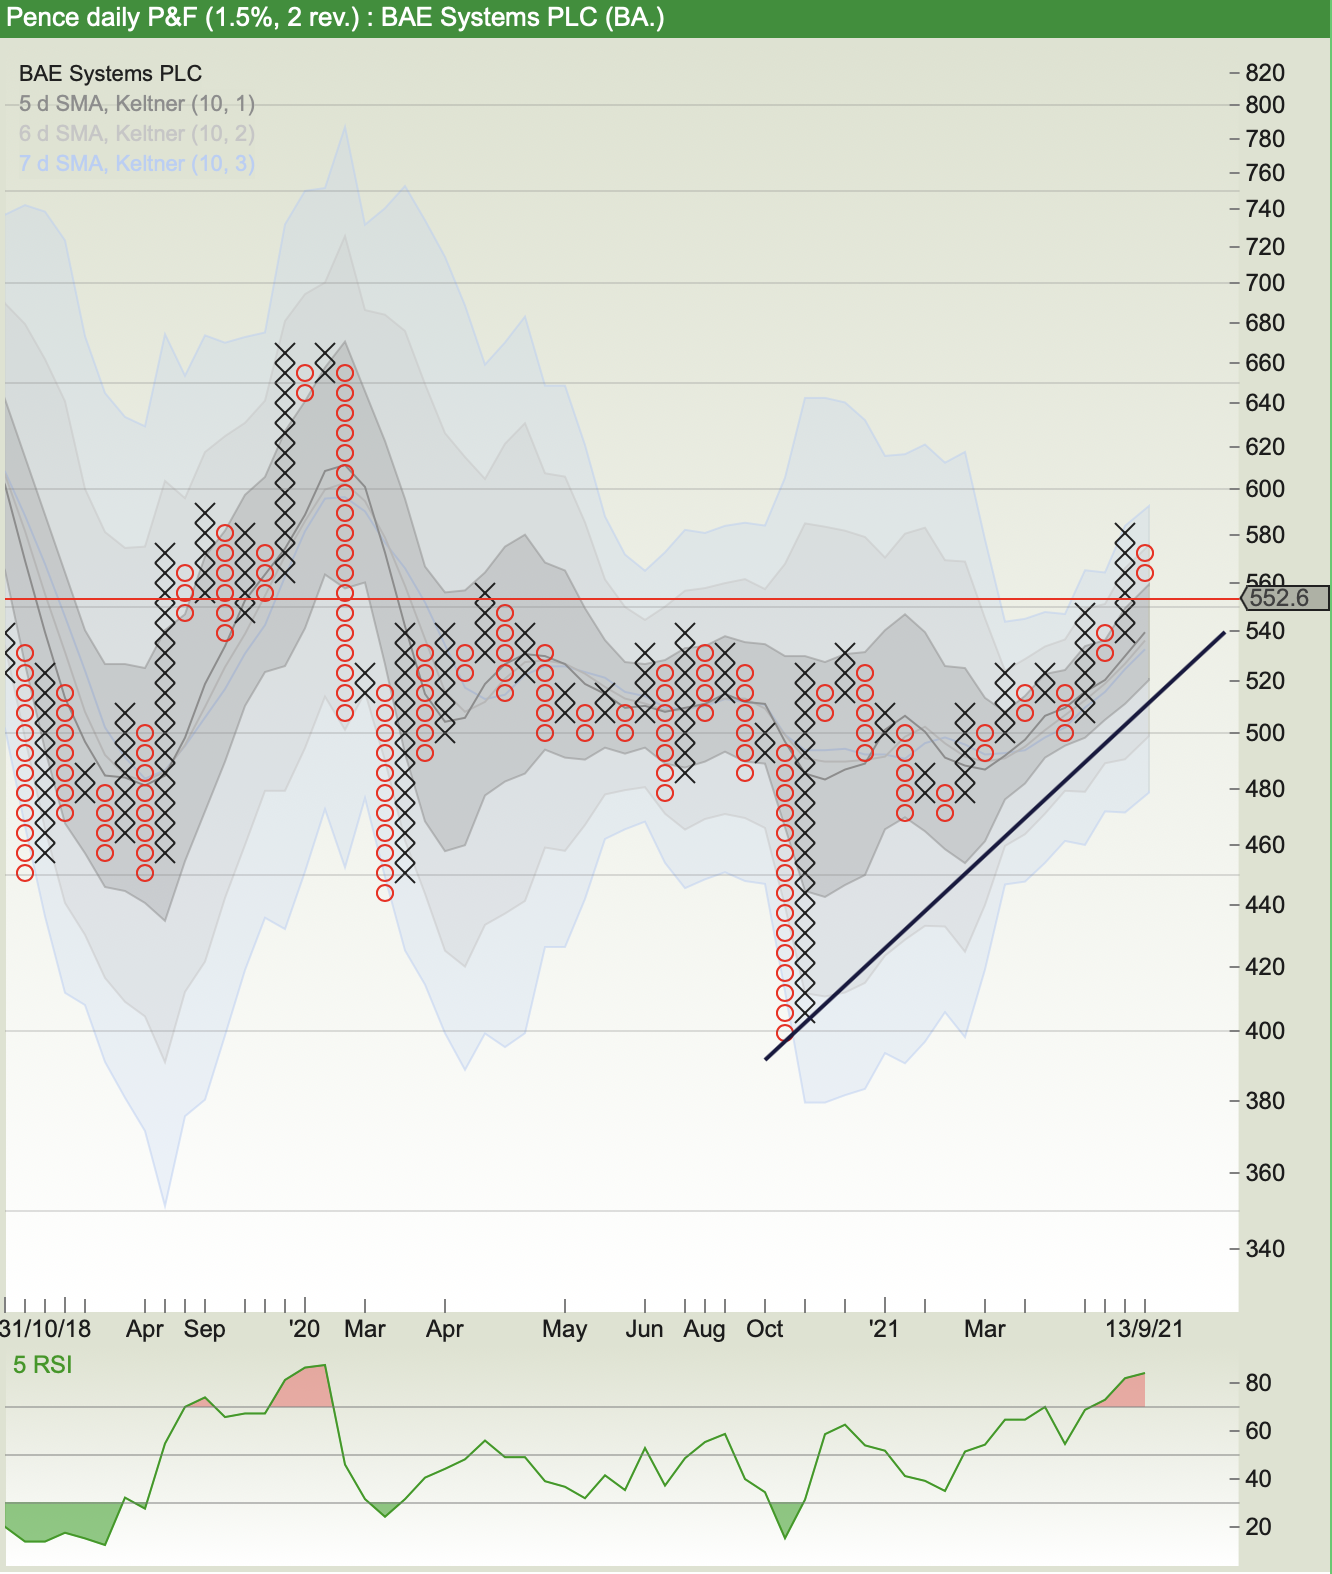
BAE Systems
Below is a close x 2 chart based upon the box size created using standard deviation.
I recently bought and sold BAE. This chart shows the strength of the current trend above the bull line with a great price target at 679p. On a decent pullback I will buy it again. If I had created this chart before selling BAE, I would have held it a little longer than I did.
Telecom Plus
What a disaster! It didn’t travel in the direction I expected (well not for long). I bought at 1149p and sold once a selling pattern had developed at 1135p. It’s dropped ever since.
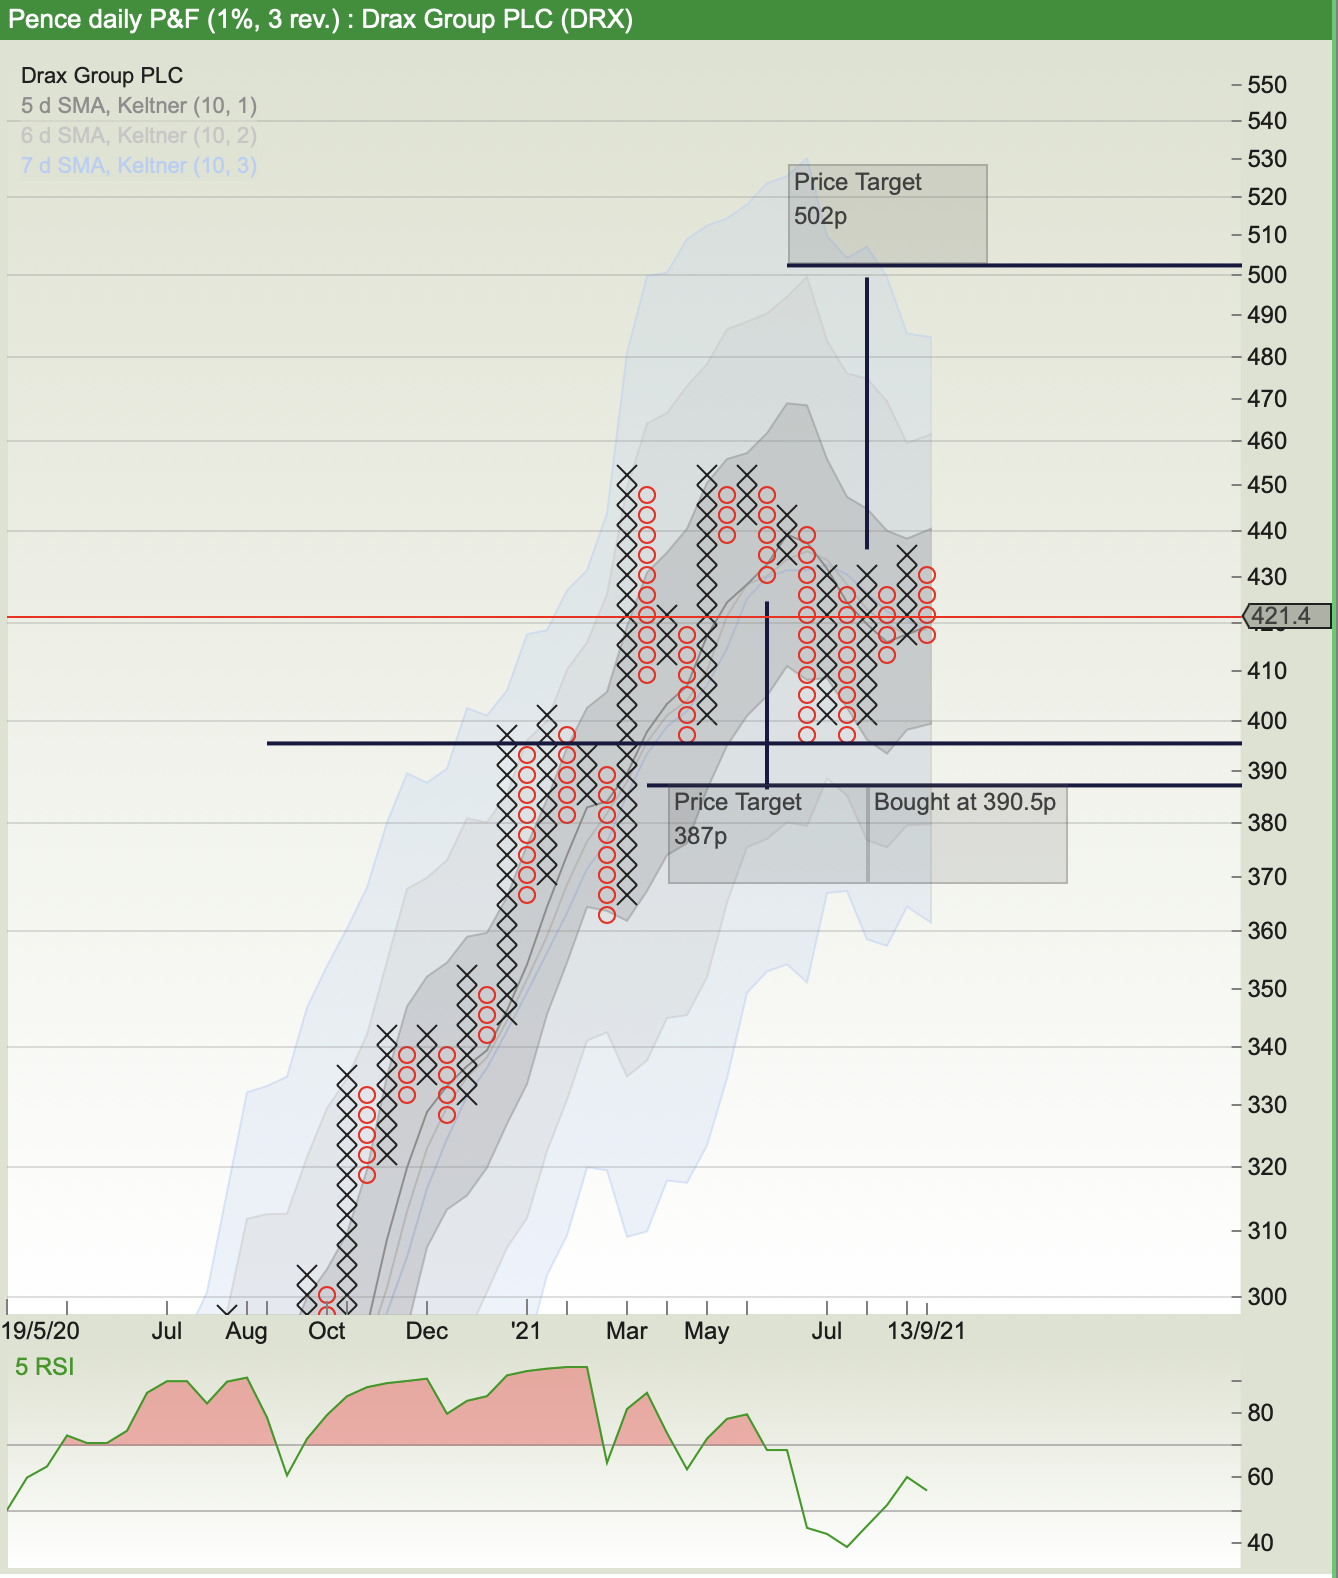
Drax Group
I bought Drax in August after it revisited its support at 395p. It had a downward price target of 387p so I set my buy order at 390.5p. The buy was based upon the support being revisited and the price target. The share was also very bullish. I was looking to add an energy company to my portfolio and Drax was paying a 4% dividend. I also liked the look of the forecasts which are nearly all in the green (except the Free cash flow for 2021).
DRAX FORECASTS
£ millions unless stated
| Year | 2021 | 2022 | 2023 | |||
|
Turnover |
4,470.5 |
5.56% |
4,872.9 |
9.00% |
4,948.7 |
1.56% |
|
EBITDA |
375.6 |
2.59% |
509.6 |
35.7% |
581.6 |
14.1% |
|
EBIT |
183.3 |
63.7% |
313.5 |
71.0% |
382.2 |
21.9% |
|
Pre-tax profit |
115.6 |
116.2% |
250.4 |
116.6% |
324.3 |
29.5% |
|
Post-tax profit |
102.1 |
5.87% |
205.8 |
101.7% |
261.4 |
27.0% |
|
EPS (p) |
26.0 |
9.41% |
50.1 |
92.5% |
65.2 |
30.0% |
|
Dividend (p) |
18.7 |
9.60% |
20.6 |
9.81% |
22.6 |
9.60% |
|
Capex |
269.0 |
54.2% |
149.6 |
-44.39% |
153.0 |
2.27% |
|
Free cash flow |
132.0 |
-10.02% |
321.0 |
143.2% |
403.0 |
25.5% |
|
Net borrowing |
1,053.4 |
30.7% |
866.7 |
-17.72% |
633.6 |
-26.90% |
|
NAV |
1,362.5 |
1.72% |
1,486.0 |
9.06% |
1,652.5 |
11.2% |
_____________
Well, it’s back to studying for my final year of A levels. I have recently designed a share trading simulation game and I am now starting to write the code for it. I will be using this for my course work in Computer Science.
The Student Investor Challenge should start in October if the London Institute of Banking and Finance decide to run it this year, so hopefully I will update you and show you all the shares I am buying and selling and explain the rules.
Thank you to everyone who left comments for my last blog. If anyone has any helpful advice, please let me know!
Something I have found very helpful is that as I write these blogs, I realise how much I do and don’t know. I have an awful lot to learn, but I love the whole subject, especially Point and Figure.
William St John Bacon
Read William’s previous article here and leave your top investing and trading tips for him in the comments section below.
This article is for educational purposes only. It is not a recommendation to buy or sell shares or other investments. Do your own research before buying or selling any investment or seek professional financial advice.


Very interesting indeed
I like the idea of point and figure as a means to cut out noise, but feel that by throwing away time, in favour of ‘smoothed’ volatility on the X axis, one can lose good information. For instance periods of low volatility, near support, which may offer a low risk trade entry are not visible (depending on settings). However, what is useful are concepts/patterns such as a ‘bull catapult’ , the equivalent of a ‘double bottom’ with the right bottom undercutting the left – a shakeout that removes weak holders – a psychological explanation of the Xs and Os. Of course in the confusing world of TA a PnF ‘double bottom’ isn’t the same structure as the as a non-PnF ‘double bottom’. As a means of encoding a lot of information they are very good, however, they are a lossy algorithm.
Also with sharepad there is a scaling issue – look at GAW over one year (log, 1×3). Also switch time to weekly – it should make no difference if implemented with no reference to time. When I try to trade high relative (to index) strength shares, this unfortunately detracts from their usefulness. PnF is very good at identifying clear zones of prior support and resistance and also for thinking about how the participants were probably feeling. Take a high pole warning though. A ‘steady riser’ is indistinguishable from something clearly extended on non-PnF charts. Again loss of information as time has been thrown away.
I can’t though see the mathematical point of trying to apply time based indicators to a not-time axis. This just escapes my comprehension. Not that I didn’t try it. I just could not work out what it meant.
High (to index) Relative Strength (RS) is the equivalent of just picking strong performers. Then it is ‘time’ over which it is measured. I think Minervini looks for a minimum of 6 weeks +ve RS, while seeking candidates from the top 90% annual RS. PnF RS could be useful here as it is ‘RS since the last correction’ that is the true sign of strength. This is currently easier to see on non-PnF charts in my opinion. I’d love it as a filter though!
Good idea re the VIX chart. Interestingly this brings volatility back although it is based on US market volatility over time. I’ve backtested a lot of TA and found it wanting, in isolation. However there is a truism; periods of high volatility are followed by periods of low volatility. Periods of low volatility give low risk entries to traders. Periods of high volatility, at extremes, give opportunities to both traders and investors (i.e. they lead into areas of high/low value). So I guess my issue with PnF is that it hides the low volatility setups.
Thank you so much for your very helpful analysis, it’s greatly appreciated.
you are watching too many ma’s, something you
see regularly.
Pick the one you want to trade and maybe the
200dma where above you would hope the price
will go higher and below fear it will go lower.
good luck with your p&f charts, where u will have
more successes than clunkers. if u want to
visualise the trend maybe have a look at a RENKO
chart.
chart.
Thank you. Good advice.
Hi there,
Very interesting to read your article William and you’re doing some good stuff with P&F. I note that you’re a programmer so maybe we’ll see some trading software from you in the future! Aim high!! 🙂
You beat me by a few years 🙂 as I only started ‘investing/trading’ at the age of 52yrs! As long as you’re sensible and manage your risk you can’t help but become very wealthy by the time you retire….(if our current financial systems last that long, that is!). I’d be extremely surprised if you avoided being rich, due to your youth and compound interest. Buffet attributed HIS success to starting at eleven yrs old and also his longevity genes, which have kept him going into his nineties!! Notably, with a nod to compound interest, he made HALF his fortune AFTER the age of 65, if I remember correctly.
https://www.amazon.co.uk/Psychology-Money-Timeless-lessons-happiness/dp/0857197681/ref=asc_df_0857197681/?tag=googshopuk-21&linkCode=df0&hvadid=427902758346&hvpos=&hvnetw=g&hvrand=13223534569603062878&hvpone=&hvptwo=&hvqmt=&hvdev=c&hvdvcmdl=&hvlocint=&hvlocphy=1006722&hvtargid=pla-947774987444&psc=1&th=1&psc=1&tag=&ref=&adgrpid=103526071910&hvpone=&hvptwo=&hvadid=427902758346&hvpos=&hvnetw=g&hvrand=13223534569603062878&hvqmt=&hvdev=c&hvdvcmdl=&hvlocint=&hvlocphy=1006722&hvtargid=pla-947774987444
When I started, circa 1994, things were very different and it was MUCH more expensive to dip in and out of shares which made trading difficult/impossible for individuals. You merely made the Market Makers and their Broker chums rich (and purveyors of software too!!! Hello Ionic!!! 🙂 I started with ‘Channel Analysis’ by Brian Millard and used his software for a while (there was no Internet then so I just went down to WH Smiths and bought the book I thought looked interesting….subscribed to a couple of magazines…and newspapers… gave the latter up as a waste of money and realisation that journalists have to fill columns all the time; with rubbish if there’s nothing else! 🙂
Back then, I used to buy data for my Metastock from a Mancunian who said on the phone “Channel Analysis’ isn’t proper Technical Analysis” and he was right!
Later I bought the Jeremy DuPlessis’ book and trialled his self written DOS software which was pretty good but expensive at the time. (He interested me because he was a South African and I lived there for eight odd (sometimes, very odd) years. Spoke to him on the phone several times. Point and figure has NEVER really caught on in the mainstream and there’s a good reason for that. I don’t think it’s waiting to be discovered after all this time. and it’s probably out of its time now with all the instant data and software now available down to 1min charts!!
If you take my advice (and at 76yrs no one has yet!! 🙂 you will buy (if you haven’t already):
Stan Weinstein’s TA ‘4 Stage’ classic with great tests-
https://www.amazon.co.uk/Stan-Weinsteins-Secrets-Profit-Markets/dp/1556236832
William O’Neil’s CANSLIM/TA classic:
https://www.amazon.co.uk/How-Make-Money-Stocks-Winning/dp/0071614133/ref=pd_lpo_2?pd_rd_i=0071614133&psc=1
Mark Minervini’s original book:
https://www.amazon.co.uk/Trade-Like-Stock-Market-Wizard/dp/0071807225/ref=pd_lpo_1?pd_rd_i=0071807225&psc=1
These are in the order of publication and they build on each other. If you read all of those a few times each you’d be terrifically prepared and ready to battle although I can see that you have, clearly, put in a lot of work already. Obviously there’s some great books on company evaluation too if the company fundamental side of life appeals. I just said on twitter that it’s best to evaluate the company BUT to look at the charts too (with a good understanding of both.. it takes a time!) and when fundamentals AND chart price action coincide THAT’S the time to light the blue touch paper and ‘retire’…not immediately, of course!! 🙂
Some never to be broken rules can be seen in those books…eg, just one simple one; if you’re going long DO NOT GO LONG if the price is below 150MA etc etc
You’ve probably heard of the ‘7.2yr rule’ wrt compound interest (that was a contributing factor to my belief in trading when I started); ie. you can double your money in 7.2yrs if you can make 10%/yr. I recently came up with another one which is more important at MY age and that is my ONE year rule 🙂 This is where, if you can make 1.3% per week, you can double your money in a year! People like Mark Minervini, David Ryan, Oliver Kell…. have all made verified three figure % returns in the USA annual investing competitions. That’s NOT saying that it’s easy to emulate especially when you have family, work, health considerations etc etc, deflecting you from your goal! but it shows you the possibilities. The learning curve is lengthy and you MUST, at least, use Stop Losses as a basis of Risk Management. I have a feeling that I could be teaching you to suck eggs!!
Oliver Kell interview: https://youtu.be/eME0S4lwEz0 Richard Moglen conducts some excellent and informative interviews.
Mark Minervini and David Ryan https://www.youtube.com/watch?v=SwxR6wcB12o As a young man I suspect that you will have been all over these and others…there’s plenty!! 🙂
Have a look at Financial Wisdom’s super series of concise overviews of strategies and books, if you haven’t already.
https://www.youtube.com/watch?v=ltXlF8Z0WFg&t=24s
https://www.youtube.com/c/FinancialWisdom/videos Truly excellent IMvHO. Like a lot of ‘enthusiasts’ they always try to sell courses. I’ve ALWAYS wondered why, if they’re so marvellous at trading and they want even more money, why don’t they just do more trading? It’s not that they’re altruistic as they’re not frightened to charge substantial sums for their courses etc as, of course, do software sellers 🙂 Martin Stamp, owner of Ionic was on the TV programme ‘The Secret Millionaire’ years back (Don’t tell him I know!! :). Mind you the original Sharescope was a REVELATION when it came out and I could write a lot about it! 🙂 eg until Sharescope was released (I’ve used it and -Pad continuously from 1999… used to get PRINTED MANUALS/CD-ROMS back then!) I used to spend 2-3hrs every Saturday afternoon, downloading data, updating it and manually keeping the FTSE constituent stocks up to date. Sharesope obviated the need for that, thank goodness!
I’m also quite enamoured by Haiken-Aishi candle trading strategies too. eg https://www.youtube.com/watch?v=p7ZYrxZo_38 I like this chap’s videos and this strategy is worthy of consideration for your armoury!
https://www.youtube.com/watch?v=HDhbRrMHLbI Not saying go on their courses…EVERYONE’S selling courses etc. BEWARE!!! Twitter is awash with people offering advice but eventually want to sell you a course or something. Avoid unless you have the capital to fast track.
I’ve had the tab open to comment on your exposition but only just got around to it so it’ll be a miracle if it’s even read. Sorry it’s so rambling and so long! The other thing I did at 52yrs was to learn to touch type, using KP Type! 🙂
I wish you every good fortune in your quest! Enjoy! At your age I was designing and building model aircraft and inventing stuff… but hey, we’re all different… thank Goodness!! 🙂
I’ve THOROUGHLY enjoyed EVERY minute of my journey in shares although I’m unlikely to be rich now; unless I can approach the 1% per week! 🙂
Good Luck
Frank
Hi there,
Very interesting to read your article William and you’re doing some good stuff with P&F. I note that you’re into programming so maybe we’ll see some trading software from you in the future! Aim high!! 🙂
You beat me by a few years 🙂 as I only started ‘investing/trading’ at the age of 52yrs! As long as you’re sensible and manage your risk you can’t help but become very wealthy by the time you retire….(if our current financial systems last that long, that is!). I’d be extremely surprised if you avoided being rich, due to your youth and compound interest. Buffet attributed HIS success to starting at eleven yrs old and also his longevity genes, which have kept him going into his nineties!! Notably, with a nod to compound interest, he made HALF his fortune AFTER the age of 65, if I remember correctly.
https://www.amazon.co.uk/Psychology-Money-Timeless-lessons-happiness/dp/0857197681/ref=asc_df_0857197681/?tag=googshopuk-21&linkCode=df0&hvadid=427902758346&hvpos=&hvnetw=g&hvrand=13223534569603062878&hvpone=&hvptwo=&hvqmt=&hvdev=c&hvdvcmdl=&hvlocint=&hvlocphy=1006722&hvtargid=pla-947774987444&psc=1&th=1&psc=1&tag=&ref=&adgrpid=103526071910&hvpone=&hvptwo=&hvadid=427902758346&hvpos=&hvnetw=g&hvrand=13223534569603062878&hvqmt=&hvdev=c&hvdvcmdl=&hvlocint=&hvlocphy=1006722&hvtargid=pla-947774987444
When I started, circa 1994, things were very different and it was MUCH more expensive to dip in and out of shares which made trading difficult/impossible for individuals. You merely made the Market Makers and their Broker chums rich (and purveyors of software too!!! Hello Ionic!!! 🙂 I started with ‘Channel Analysis’ by Brian Millard and used his software for a while (there was no Internet then so I just went down to WH Smiths and bought the book I thought looked interesting….subscribed to a couple of magazines…and newspapers… gave the latter up as a waste of money and realisation that journalists have to fill columns all the time; with rubbish if there’s nothing else! 🙂
Back then, I used to buy data for my Metastock from a Mancunian who said on the phone “Channel Analysis’ isn’t proper Technical Analysis” and he was right!
Later I bought the Jeremy DuPlessis’ book and trialled his self written DOS software which was pretty good but expensive at the time. (He interested me because he was a South African and I lived there for eight odd (sometimes, very odd) years. Spoke to him on the phone several times. Point and figure has NEVER really caught on in the mainstream and there’s a good reason for that. I don’t think it’s waiting to be discovered after all this time. and it’s probably out of its time now with all the instant data and software now available down to 1min charts!!
If you take my advice (and at 76yrs no one has yet!! 🙂 you will buy (if you haven’t already):
Stan Weinstein’s TA ‘4 Stage’ classic with great tests-
https://www.amazon.co.uk/Stan-Weinsteins-Secrets-Profit-Markets/dp/1556236832
William O’Neil’s CANSLIM/TA classic:
https://www.amazon.co.uk/How-Make-Money-Stocks-Winning/dp/0071614133/ref=pd_lpo_2?pd_rd_i=0071614133&psc=1
Mark Minervini’s original book:
https://www.amazon.co.uk/Trade-Like-Stock-Market-Wizard/dp/0071807225/ref=pd_lpo_1?pd_rd_i=0071807225&psc=1
These are in the order of publication and they build on each other. If you read all of those a few times each you’d be terrifically prepared and ready to battle although I can see that you have, clearly, put in a lot of work already. Obviously there’s some great books on company evaluation too if the company fundamental side of life appeals. I just said on twitter that it’s best to evaluate the company BUT to look at the charts too (with a good understanding of both.. it takes a time!) and when fundamentals AND chart price action coincide THAT’S the time to light the blue touch paper and ‘retire’…not immediately, of course!! 🙂
Some never to be broken rules can be seen in those books…eg, just one simple one; if you’re going long DO NOT GO LONG if the price is below 150MA etc etc
You’ve probably heard of the ‘7.2yr rule’ wrt compound interest (that was a contributing factor to my belief in trading when I started); ie. you can double your money in 7.2yrs if you can make 10%/yr. I recently came up with another one which is more important at MY age and that is my ONE year rule 🙂 This is where, if you can make 1.3% per week, you can double your money in a year! People like Mark Minervini, David Ryan, Oliver Kell…. have all made verified three figure % returns in the USA annual investing competitions. That’s NOT saying that it’s easy to emulate especially when you have family, work, health considerations etc etc, deflecting you from your goal! but it shows you the possibilities. The learning curve is lengthy and you MUST, at least, use Stop Losses as a basis of Risk Management. I have a feeling that I could be teaching you to suck eggs!!
Oliver Kell interview: https://youtu.be/eME0S4lwEz0 Richard Moglen conducts some excellent and informative interviews.
Mark Minervini and David Ryan https://www.youtube.com/watch?v=SwxR6wcB12o As a young man I suspect that you will have been all over these and others…there’s plenty!! 🙂
Have a look at Financial Wisdom’s super series of concise overviews of strategies and books, if you haven’t already.
https://www.youtube.com/watch?v=ltXlF8Z0WFg&t=24s
https://www.youtube.com/c/FinancialWisdom/videos Truly excellent IMvHO. Like a lot of ‘enthusiasts’ they always try to sell courses. I’ve ALWAYS wondered why, if they’re so marvellous at trading and they want even more money, why don’t they just do more trading? It’s not that they’re altruistic as they’re not frightened to charge substantial sums for their courses etc as, of course, do software sellers 🙂 Martin Stamp, owner of Ionic was on the TV programme ‘The Secret Millionaire’ years back (Don’t tell him I know!! :). Mind you the original Sharescope was a REVELATION when it came out and I could write a lot about it! 🙂 eg until Sharescope was released (I’ve used it and -Pad continuously from 1999… used to get PRINTED MANUALS/CD-ROMS back then!) I used to spend 2-3hrs every Saturday afternoon, downloading data, updating it and manually keeping the FTSE constituent stocks up to date. Sharesope obviated the need for that, thank goodness!
I’m also quite enamoured by Haiken-Aishi candle trading strategies too. eg https://www.youtube.com/watch?v=p7ZYrxZo_38 I like this chap’s videos and this strategy is worthy of consideration for your armoury!
https://www.youtube.com/watch?v=HDhbRrMHLbI Not saying go on their courses…EVERYONE’S selling courses etc. BEWARE!!! Twitter is awash with people offering advice but eventually want to sell you a course or something. Avoid unless you have the capital to fast track.
I’ve had the tab open to comment on your exposition but only just got around to it so it’ll be a miracle if it’s even read. Sorry it’s so rambling and so long! The other thing I did at 52yrs was to learn to touch type, using KP Type! 🙂
I wish you every good fortune in your quest! Enjoy! At your age I was designing and building model aircraft and inventing stuff… but hey, we’re all different… thank Goodness!! 🙂
I’ve THOROUGHLY enjoyed EVERY minute of my journey in shares although I’m unlikely to be rich now; unless I can approach the 1% per week! 🙂
Good Luck
Frank
Hi Frank – Thank you so much for such a wealth of information and sharing your years of experience with me. There is so much for me to learn and I am really looking forward to reading these books, hopefully over the Xmas holiday.
I really appreciate all the time you have taken to write such an interesting response. I love trading and your advice is brilliant! Thank you.
Will