
I should start by saying that I am no technical analysis whiz, and this article will likely bore those with an encyclopaedic knowledge of buy/sell signals and chart shapes (cup and handle, anyone?).
I got into investing after I started working at ShareScope, and I desperately wanted it to be easy. Technical analysis seemed like a great shortcut, and with the impressive filters on SharePad, Golden Cross looked to be a no-brainer.
For those of you not in the know, a Golden Cross occurs when a short-term moving average crosses over a long-term moving average upwards, ideally while both moving averages are already in an upward trajectory. The idea is that this captures upward price momentum, and is a “reliable” buy signal. The opposite, when the short-term moving average crosses downwards, is the sell signal, the Dead Cross.
SharePad allows you to filter for these signals. For the purposes of this article, I am using exponential moving averages and a 6-day / 21-day moving average combo. I would class myself as a “swing trader”, someone who wants to see positive results within a matter of weeks or months, hence the use of short moving averages. For anyone who’d rather not think about their investments for a while, the moving averages can be changed to 6-week / 21-week time frames. 50 / 200 moving averages, whether day or week, are another popular time frame.
What I wanted to find out was whether there is a predictable pattern for how anyone could trade Golden Crosses. My questions were:
- Does investing in a Golden Cross always yield a profit?
- How long after the Golden Cross can you buy the share and still yield a profit?
- Is there a predictable best time to sell?
- Are Dead Crosses a good sell signal?
My sample size is small, as I wanted to look at charts in a way that anyone could recreate. I am sure scripts could be written that would perform automatically what I have done manually, but that is beyond my reach. I chose 5 shares from the top of the alphabetical FTSE 250 to keep things random. Here’s what I found.
3i Infrastructure Ltd (3IN)
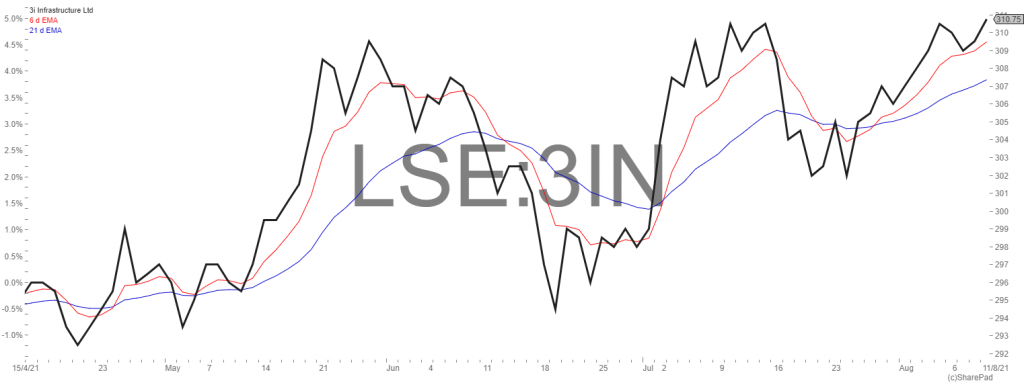
The first Golden Cross happened on 26/4/21. Since you can’t get same-day visibility when the moving averages are dependent on days, I’ve limited the opportunities to buy to the subsequent days, and those are the prices I’ll be considering. In SharePad, you can filter to find instances of Golden Crosses within fixed time periods, such as within the past 3 days.
The 3 days following the Golden Cross saw mid-prices of 295.5p, 298p and 297p, reasonable price points for a buy-in. The price then dipped, but did not bring the 6-day moving average below the 21-day moving average, and recovered shortly thereafter, rising rapidly to hold steady at around 308.5p for 7 days, with occasional highs of 310.5p. For a swing trader, this would be the time to sell.
The Dead Cross occurred on 15/6. If the trader were using this as a signal, selling within one day of the Dead Cross would have yielded a price of around 303p – still a profit, although smaller. Missing this signal or waiting any longer brought the price back down to a breakeven or loss.
As you’ll see from the chart, another Golden Cross came shortly afterwards, on 2/7. This time, the rise following the cross happened much faster, meaning there was a shorter time frame to make the buy and still end up in profit. Mid-prices over the following three days were 305p, 307p and 308p, and the price peaked only a few days later up to around 310p.
Compared with the previous Golden Cross, selling at this peak would’ve yielded a much smaller profit, and buying 3 days after the signal shrank that profit margin even further, compared with buying immediately on the day following the signal. This time, selling right after the Dead Cross was a guaranteed money-loser at around 303p.
I repeated this experiment with 4 other shares. Others gave far less opportunity to come away with a profit. A stand-out case was Aberforth Smaller Companies Trust (ASL)
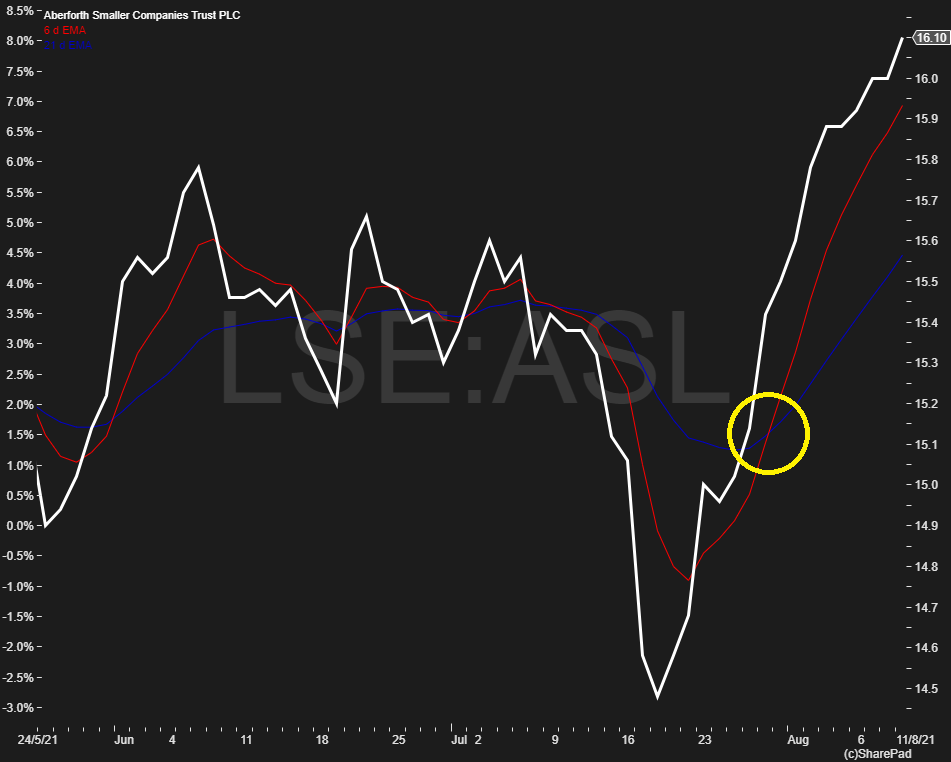
Aberforth Smaller Companies Trust (ASL)
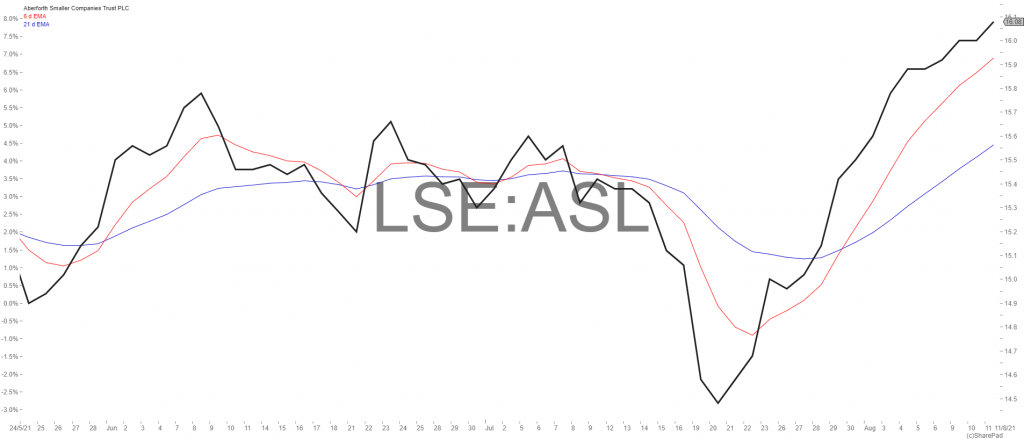
The Golden Cross on 28/05/21 performed decently. By buying in the following three days, at 1540p, 1556p or 1558p, the trader could sell at a profit a few days later when the price peaked at around 1585p. However it didn’t hold for long, only two days before the profit disappeared, and waiting for the Dead Cross to sell yielded a loss at 1518p.
The two subsequent Golden Crosses, on 22/06 and 02/07, would, in most cases, both have lead to losses if sold before the next Golden Cross occurred. In the former, buying one day after the cross would have meant buying at peak price, 1568p, and it was all downhill from there. In the latter, buying one day following the signal would have yielded a meagre profit if sold immediately, but holding on any longer would again have led to loss in the short term. There has since been a turnaround, and the most recent Golden Cross on 29/7 looks to be performing better, but it is too soon to say how long that momentum will last.
So, where do we stand with my original questions?
1. Does investing in a Golden Cross always yield a profit?
No. There is no guarantee that the upwards momentum that a Golden Cross is supposed to signal will continue.
2. How long after the Golden Cross can you buy the share and still yield a profit?
In some cases, buying up to three days following the signal still allowed the trader to make a profit. However, based on the charts looked at today, the best results come from making the buy immediately the day following the signal. However, the upside of waiting longer is that it may allow the trader to avoid sudden dips.
3. Is there a predictable best time to sell?
No. There was a good amount of variation in how long it took for the price to peak, likely due to the hundreds of other factors in play, in particular previous lines of resistance.
4. Are Dead Crosses a good sell signal?
No. In the majority of cases, waiting for the Dead Cross ended up giving the trader a breakeven or a loss. At best, the profit was meagre. Finding the sweet spot between the Golden Cross and the Dead Cross is the key.
How much insight is really here? Well, not much in truth. My experiment is extremely limited by sample size, by ignoring fundamentals, by focusing only on one kind of moving average and only one set of time frames. But the helpful takeaway that I’ve ended up with is that no, Golden Crosses alone are not an easy shortcut to amazing trading.
I’ll have to keep looking.
Laura Stutt
Have you ever tried trading with Golden Crosses? Or do you rely on another kind of signal? Let us know in the comments section below
This article is for educational purposes only. It is not a recommendation to buy or sell shares or other investments. Do your own research before buying or selling any investment or seek professional financial advice.


I use the Hull MA to the exclusion of all others. I find it smooth but extremely responsive, with little lag.
HOWEVER: I use the MA as an indicator of trend and not as a trigger. To use a farming analogy, a farmer does not look at the calendar on the 1st. March and immediatley think it’s time to get sowing. The date merely indicates the season but the weather determines when to sow.
The major market participants know there are retail traders looking to act on these moving averages and will naturally move markets to hit stops. Price action should be the trigger to trade and preferably away from points where a stop is likely to be hit.
I’ll save the rest before any reader loses the will to live. (LOL)
Its always interesting to look at strategies like this but:
1/ The sample of 5 instances tells us nothing useful. We need to look at 1000’s to learn if there is a real pattern. As Laura says perhaps someone can automate this.
2/ Markets are complex adaptive systems. The complex bit means its hard to work out (and model) what’s going on. The adaptive bit means that once you have, it doesn’t work like that any more!
Good luck
The only thing I would say would be “Whipsaws, Whipsaws and more whipsaws” will = big drawdowns at some point
If trading were that easy we’d all be doing it – MA Xovers work exceptionally well during trends, again if you can predict when trends are going to start for the long-term then you’ll be a great trader
Best thing I have found as a trader is test the method in the Forex and Commodity markets as well as a long-term sideways range of a stock/Index