
I have picked QinetiQ from my “Cash King” filter because it was one of the more reasonably priced companies that passed all the criteria. It’s debt-adjusted PE ratio is 14.

QinetiQ makes Rattler, a supersonic target that simulates air-launched anti-radiation missiles. Source: QinetiQ annual report 2019
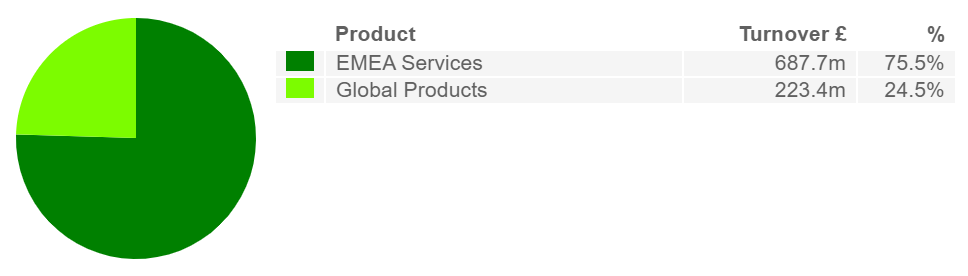
The company is a defence technology business, once part of the government’s Defence Evaluation and Research Agency but privatised in 2001. It has a long term-agreement to test and evaluate technology for the Ministry of Defence and provides services and advice to other military and industrial customers. It also invents products, sometimes funded by customers.
Source: SharePad
Today we’re going to find out more about the company by looking at its balance sheets: all 28 of them going back to 2006, when the company floated on the stock market.
Balance sheet 101
A balance sheet, officially called the Statement of Financial Position, tells us what a company owned and what it owed it at a particular point of time. What it owns are assets, and those assets are funded by obligations, aka liabilities, what it owes, and equity. Liabilities, like bank debt, often attract charges, commonly interest, and must at some point be repaid, but equity is money given to the business by shareholders in perpetuity (although they can sell their shares to other investors the company is under no obligation to repay equity). Companies with lots of liabilities are said to have weak balance sheets, because if they earn less money they may be unable to meet their obligations to pay interest or pay back loans.
Although the balance sheet only shows the company’s financial position on a particular day, it also bears the triumphs and scars of a corporate lifetime of doing business because a company’s financial position today is the cumulative total of countless transactions since it was formed.
To see a company’s balance sheet in SharePad, click on Financials and then Balance. There’s a lot of information, but by exporting the data to a spreadsheet we can calculate each balance sheet asset and liability as a percentage of the total and make the important things stand out. We’ll use total assets, although we could just as well use total liabilities and equity as it’s the same number.
Charting the financial evolution of a business
I can’t show QinetiQ’s entire balance sheet in one screenshot because it is too big, but here are the company’s assets from the last four balance sheets so we can see what we are dealing with in SharePad:
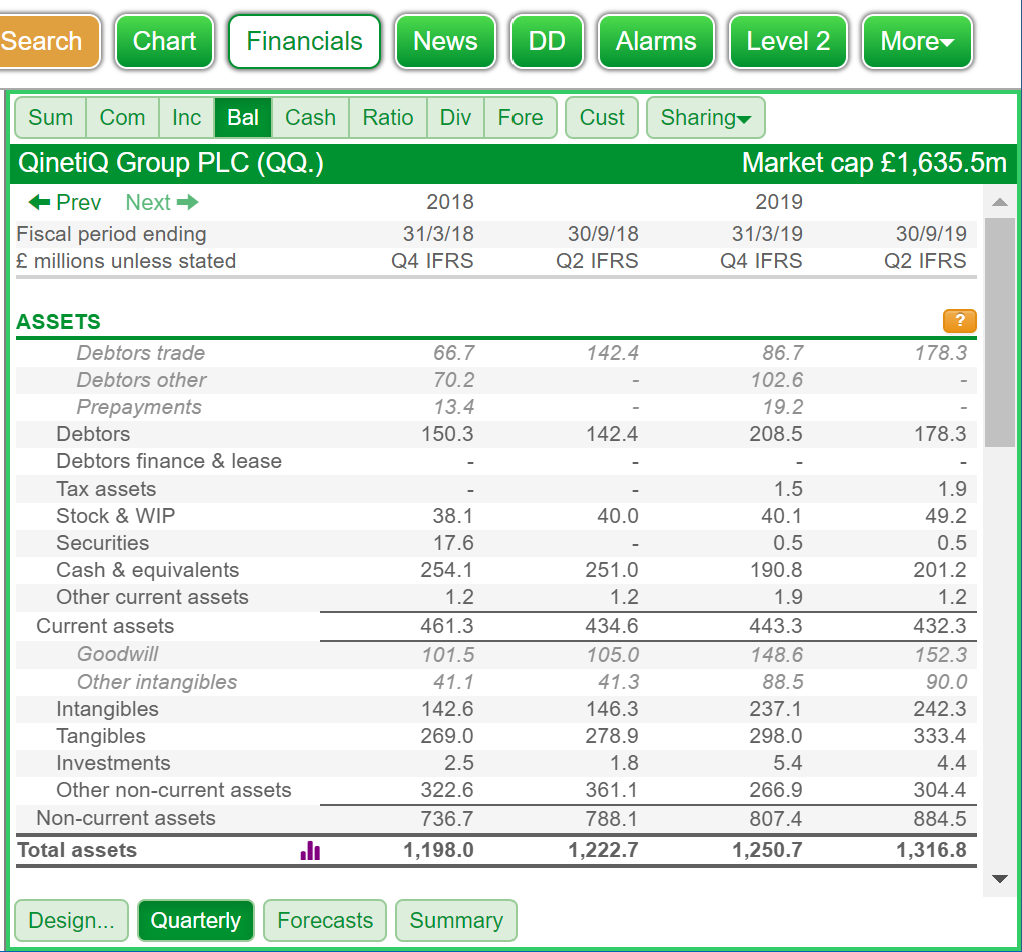
Source: SharePad
QinetiQ’s financial year ended on 31 March, but it has yet to publish the results (it should publish them in a couple of weeks time). I’ve selected Quarterly figures, so we can see the company’s interim balance sheets. Quartix actually reports every six months so the last balance sheet is for 30 September 2019.
If we add all the numbers up they will not equal total assets, because some of the lines (Debtors, Current assets, Intangibles and Non-current assets) are subtotals.
Charting every item in the balance sheet is too much for my brain to handle in one image, so I have chosen to emphasise aspects in different charts. The first one shows us QinetiQ’s liabilities and equity (click on it for a bigger version).
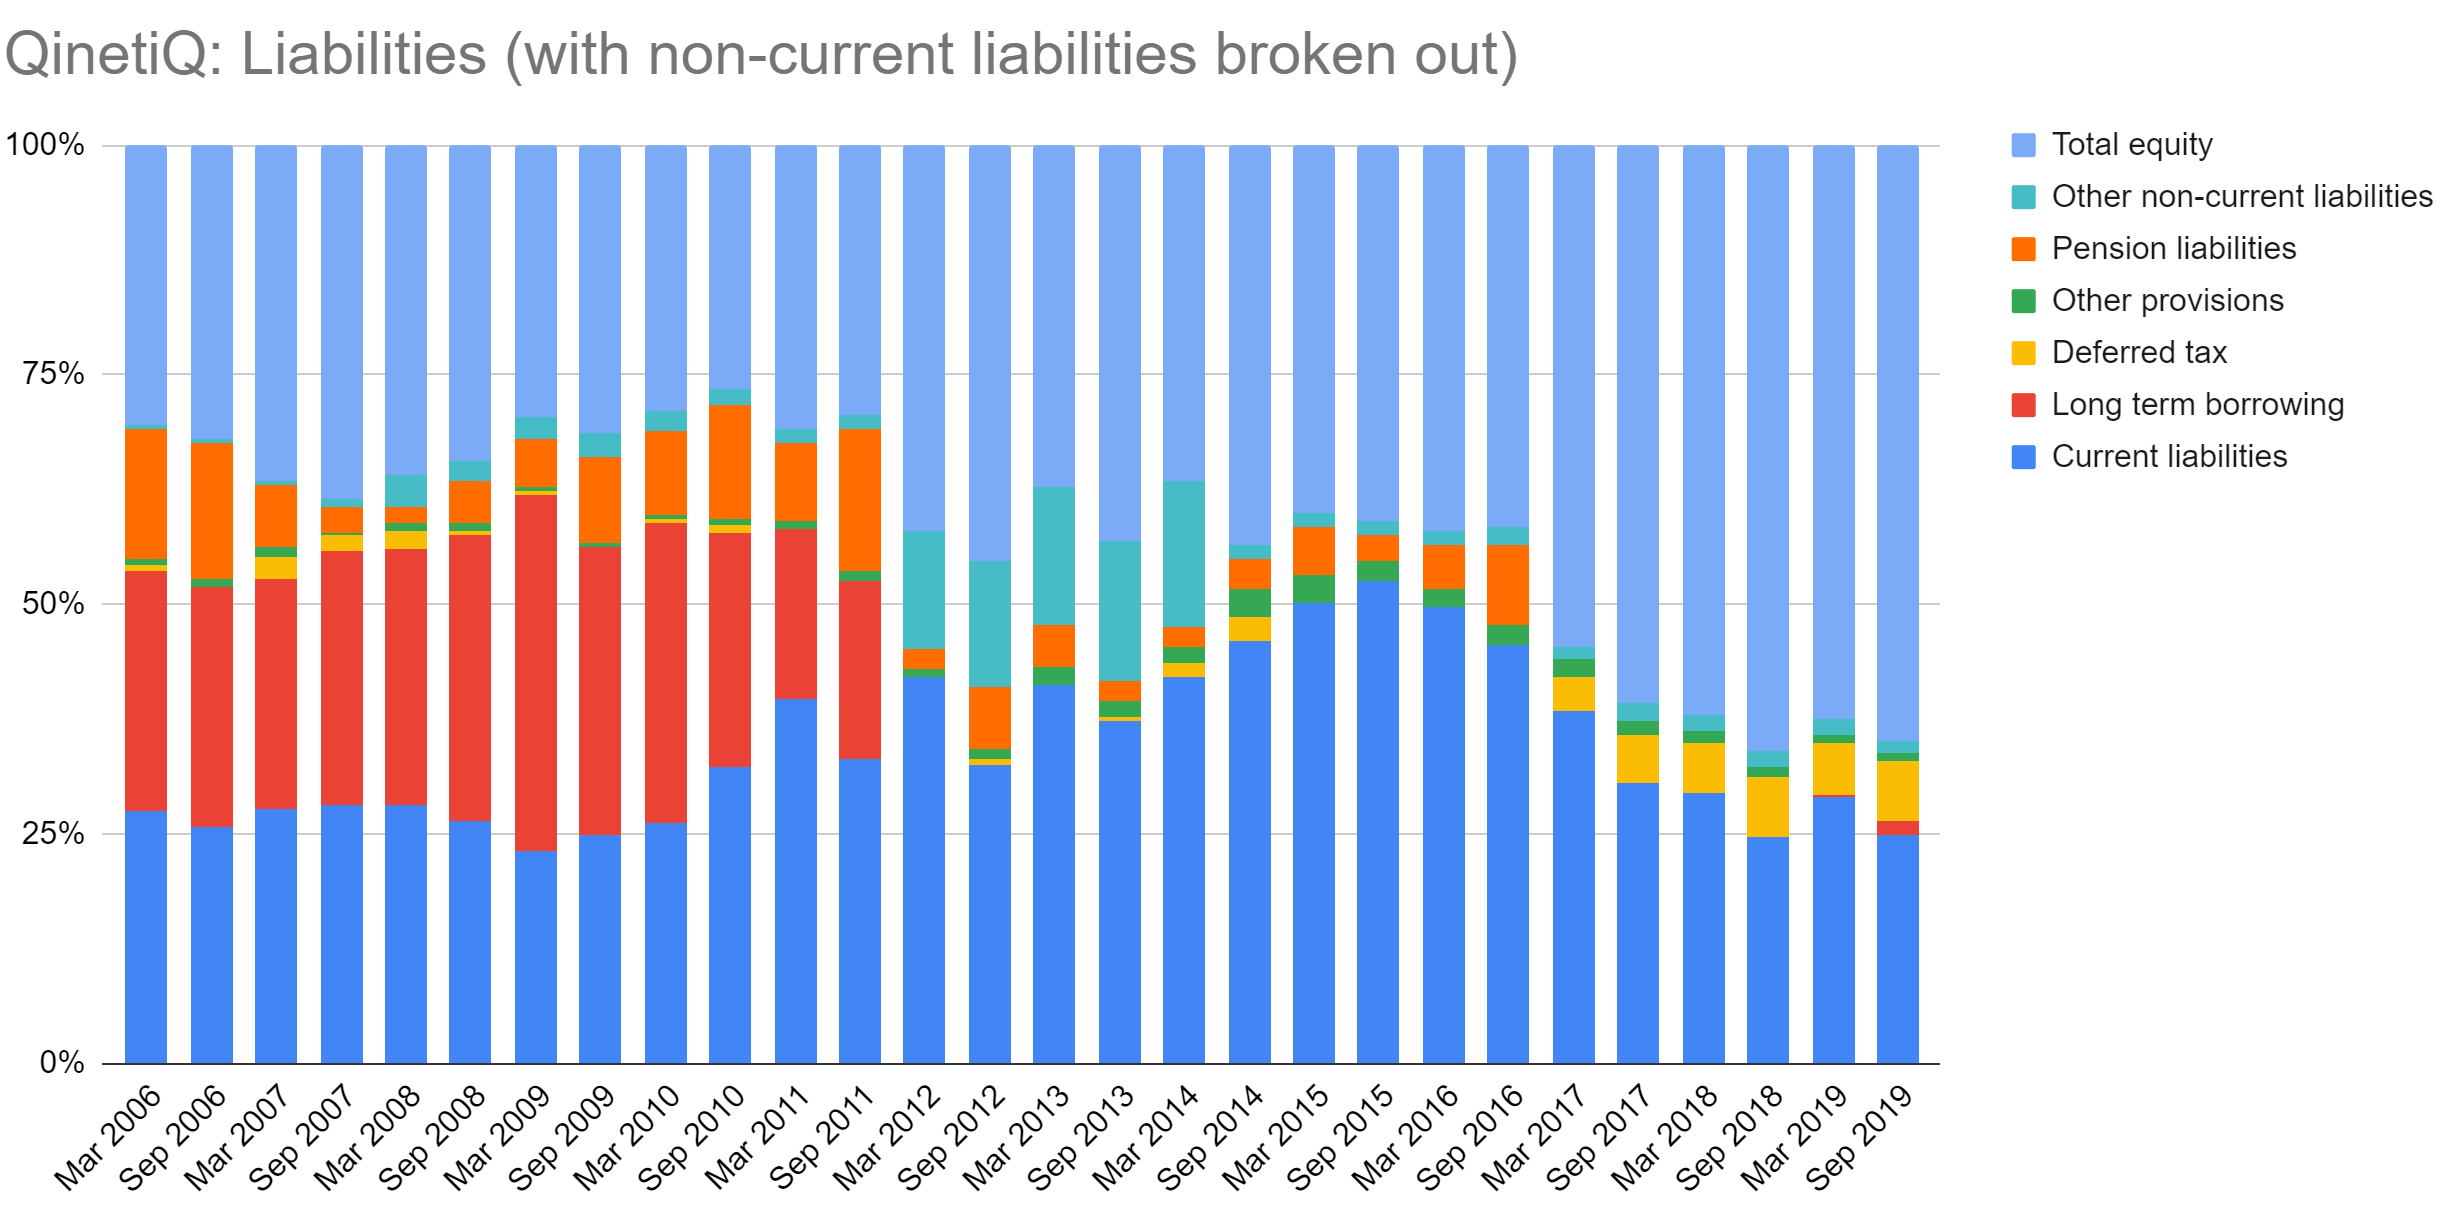
Data source: SharePad
The light blue section at the top of each column is Total equity. There is good news here, the company’s funding has changed over time with an increasing reliance on equity. In September 2019 QinetiQ was 65% funded by equity, which means total liabilities, mostly current liabilities – the dark blue sections at the bottom of each column, were 35%. Current liabilities are obligations the company expects to pay within a year, they are mostly trade creditors, money owed to suppliers. The multi-coloured mid-section of the chart is non-current liabilities. In September 2019 these accounted for just 10% of total assets, mostly deferred tax.
QinetiQ did not always have such a strong balance sheet. Its first balance sheet as a listed company had a much bigger multi-coloured midriff. The dominant colours in March 2006 were orange and red, which are pension liabilities and long term borrowing respectively. If we cast our eyes across the bars towards the middle, we can see that something big happened between September 2011 and March 2012. In September 2011 pension liabilities were 16% of total assets and long-term borrowings were 19%. The balance sheet was slightly stronger than in some previous years, but it was mostly funded by liabilities, obligations of one kind of another. Only 29% of QinetiQ’s assets were funded by equity.
Before we find out what that something big was, let’s have a look at the assets QinetiQ’s liabilities are funding. In this chart I have lumped all non-current assets together in the turquoise sections at the top of each column to put the emphasis on current assets, cash and assets the company expects to turn into cash in the following twelve months (mostly trade debtors, money owed to QinetiQ by customers):
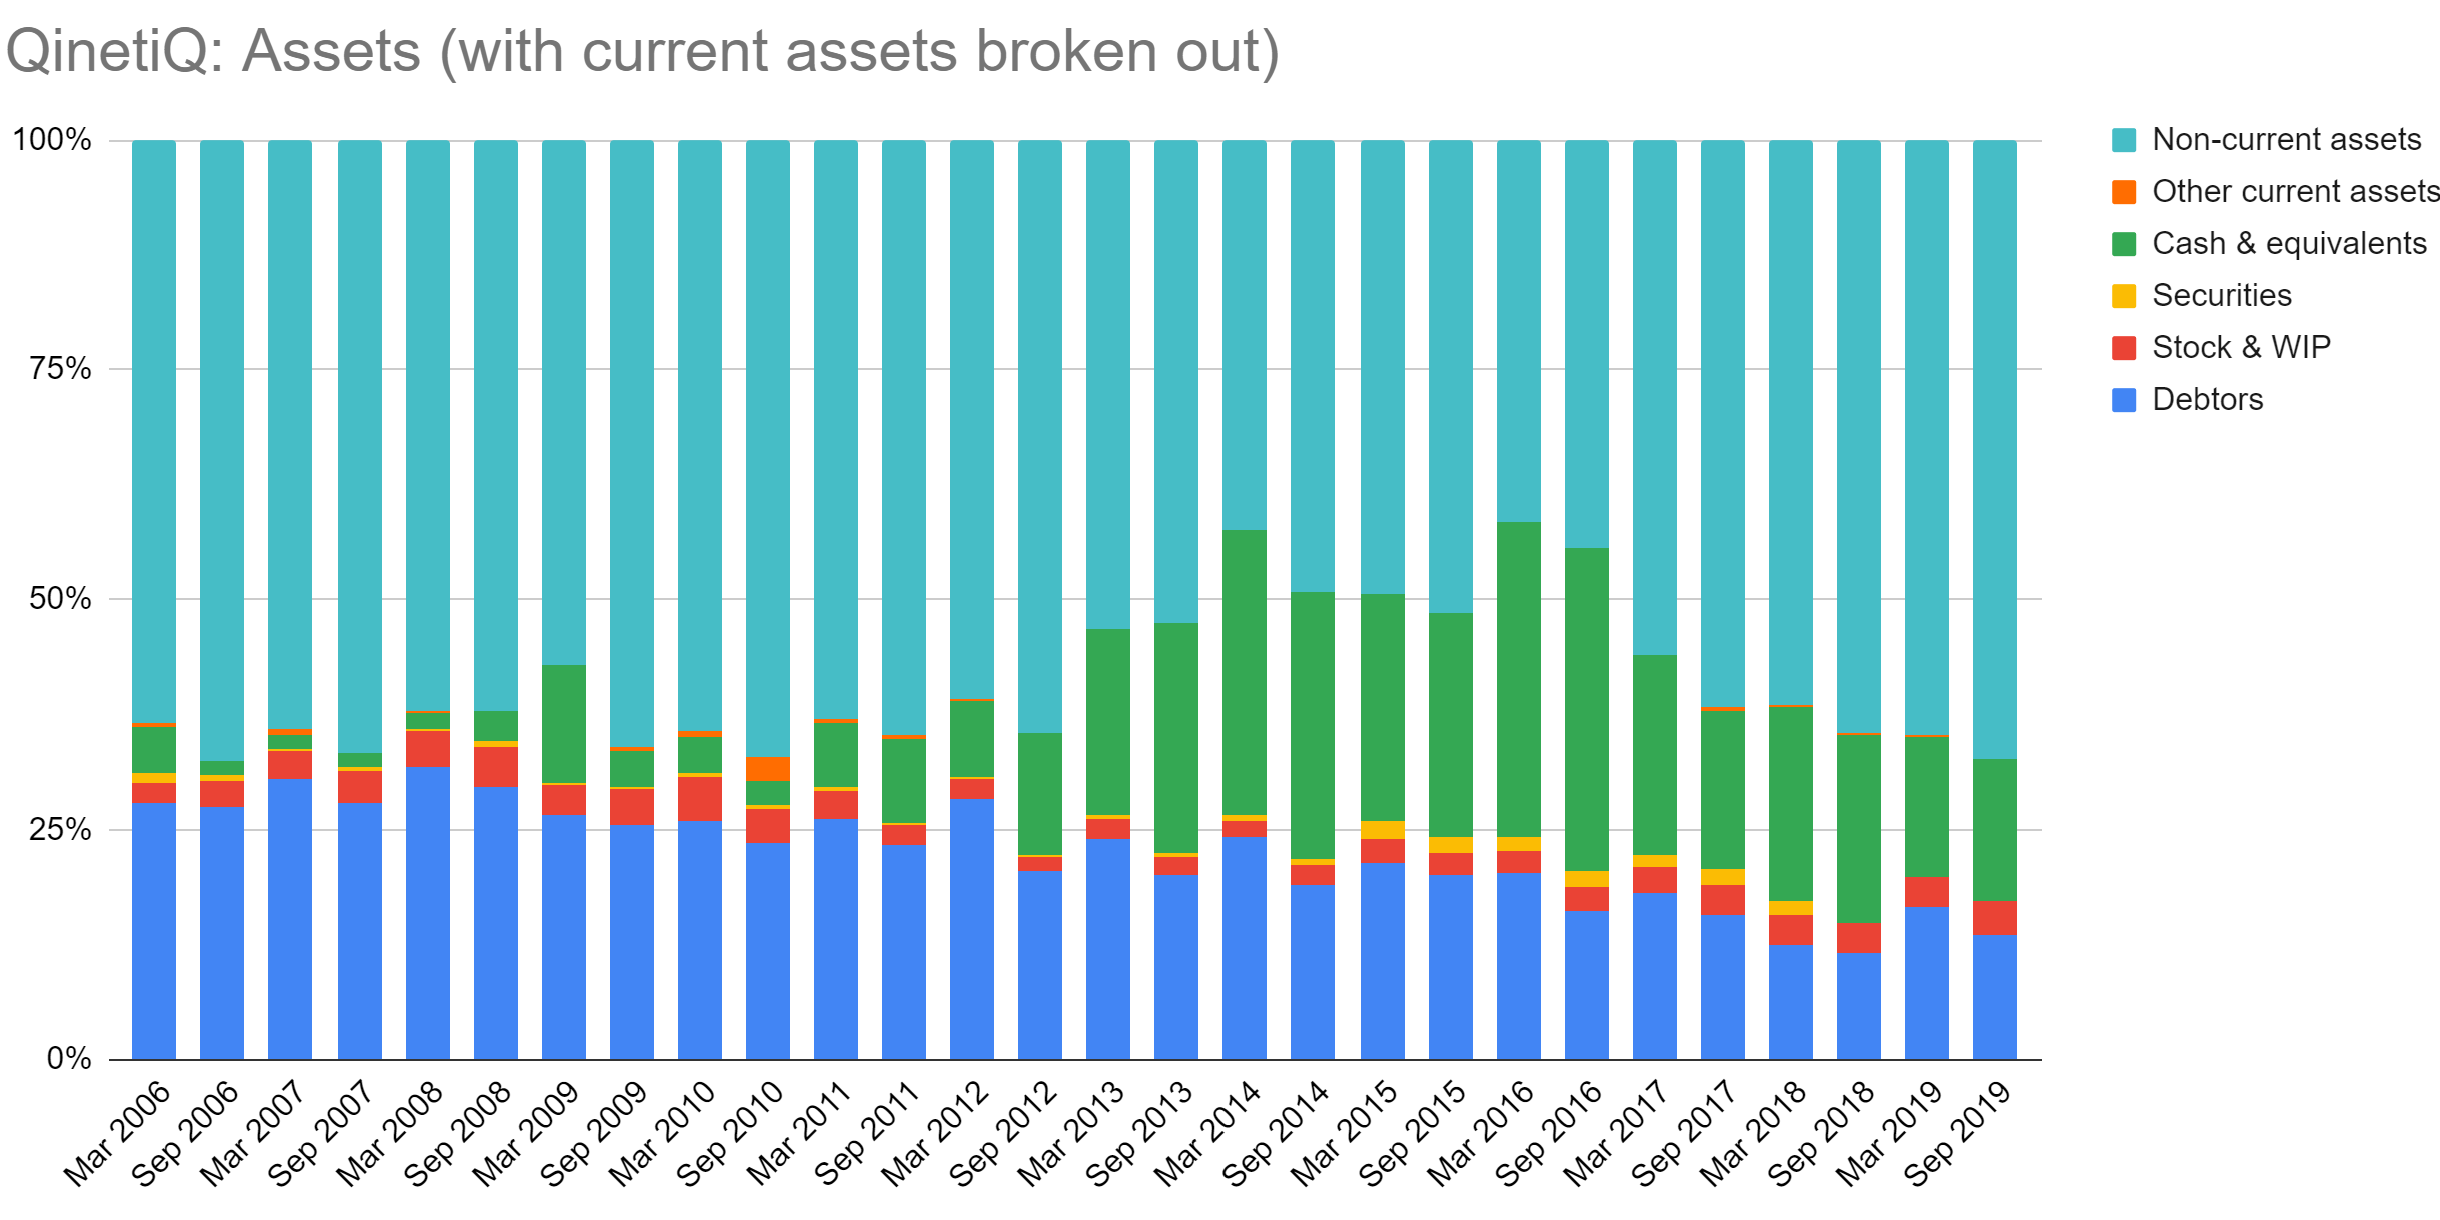
Data source: SharePad
The obvious pattern here is the emergence of cash (the green sections) as the most significant current asset at the expense of trade debtors. On balance this is a good thing because cash in the bank account is certain but there is always a chance customers won’t pay on time or at all. I suspect though, QinetiQ’s customers are reliable payers, a substantial amount of revenue still comes from the UK MoD. The improvement in QinetiQ’s cash position started before March 2012, but it accelerated afterwards.
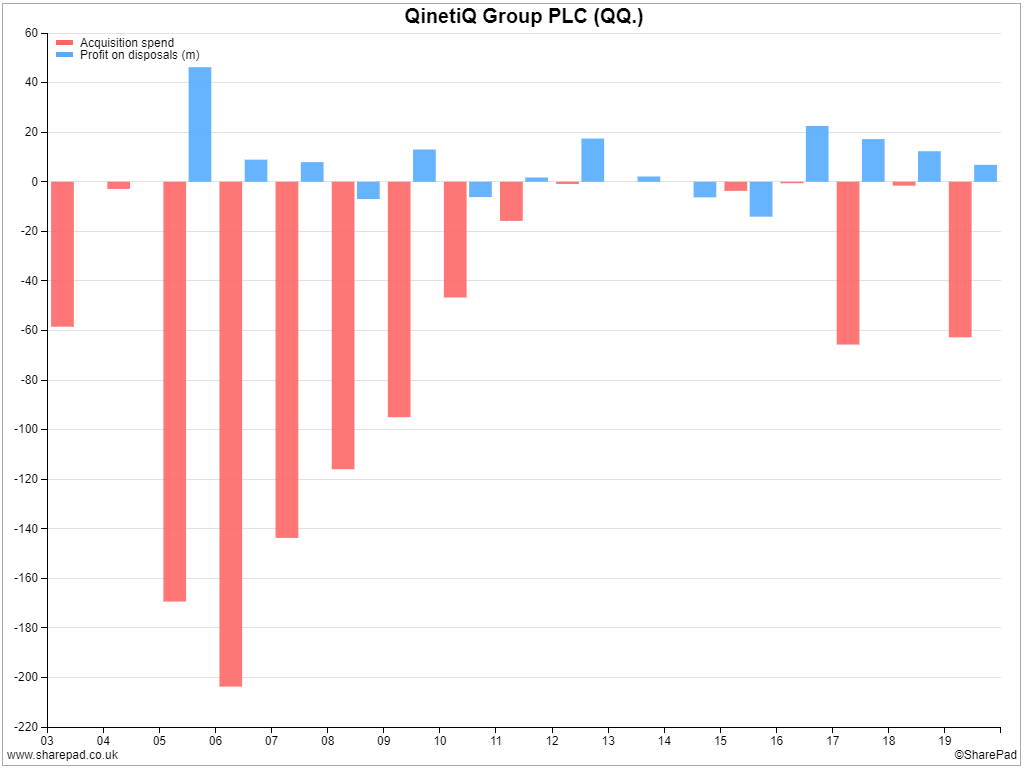
So what happened in the six-months to March 2012? QientiQ completed a two year “self-help” programme that had three objectives: focus, cultural transformation, and strengthening the balance sheet. During the prior years, between QinetiQ’s flotation and 2010, the company had been a very active acquirer and disposer of companies, which had perhaps unsurprisingly turned it into an unfocused mashup of different businesses, with a stretched balance sheet.
Two years of relative calm allowed management to get to grips with these issues, its performance in terms of cash flow improved and it was able to repair the balance sheet. I haven’t read all of the annual reports to find this out, just bits of the 2012 annual report, the acquisition history comes from a financial chart plotting acquisitions and disposals in SharePad:
In the same year, the Ministry of Defence agreed to relinquish its right to veto any transaction or activity undertaken by QinetiQ, allowing it to operate on similar commercial terms to its rivals (though the MoD still has some special rights).
Is QinetiQ worth our time?
I think it may be. QinetiQ has improved its balance sheet, which may come in handy in the year ahead. Shorn of debt and the pension deficit it is less risky than it was ten years ago, which will give investors some confidence during the pandemic. It has also earned decent returns in recent years, although heavy investment in the year to March 2019 depressed free cash flow:
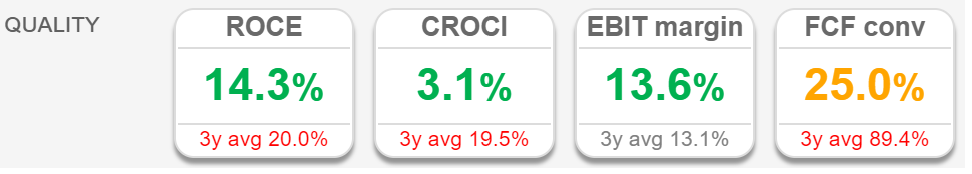
Source: SharePad
There’s lots more history to investigate, as well as the risks QinetiQ currently faces, and how its strategy will overcome them in future. But my initial foray through the numbers makes me think it will be worth finding out.
NB: I’m not saying my way is the best way, but if you’d like to see how I plotted the balance sheet charts in this article, my spreadsheet is here*. You can make a copy if you have a Google account and use it to chart other aspects of QinetiQ’s balance sheet or use the same method to analyse another company’s balance sheet.
Richard Beddard
Contact Richard Beddard by email: richard@beddard.net or on Twitter: @RichardBeddard
*To download the google sheets into excel, open the google sheets link -> click ‘File’ -> ‘Download’ -> ‘Microsoft excel’. When you open in excel you may find the formatting of the charts mean they do not display correctly. In order to rectify this, right click on the x-axis -> click ‘format axis’ -> change axis type to ‘Text axis’.
This article is for educational purposes only. It is not a recommendation to buy or sell shares or other investments. Do your own research before buying or selling any investment or seek professional financial advice.


