A New Era Dawns
Often it is easy to be so pre-occupied with the present that we miss the elephant quietly sauntering past the boardroom windows. The focus on Woodford Investment Management closing its doors over the week end was deafening. It will no doubt continue on BBC Panorama at 8.30 tonight when it airs an investigation of the fund management industry. I can’t help but feel it may be more productive to focus on what opportunities this may throw up instead. Often, at points of change, the opportunity is in exactly the asset class that it is popular to denigrate. Tony Dye, a renowned value investor of the 1990’s, was released from Phillips & Drew in February 2000 on account of his sticking to a value style precisely one month before the peak of the technology bubble. I can’t help but wonder if this is another one of those moments that seem to come when there is a change in style and investors need to reappraise their sector allocations.
As the rhetoric around small and illiquid stocks reaches a crescendo, they are starting to outperform. Last week the small cap index outperformed the FTSE 100 by 2.6% – an indicator of a turning point.

It will be a long time until the typical fund management Chief Investment Officer takes the “house” view that illiquid stocks are a good place to be meaning that any change in will take a long time. But share prices anticipate trends rather than lag trends and as investors the best returns are available to those that anticipate.
The chart below – which appeared in this note two weeks ago – shows how easy it is to miss the elephant in the room. When technology stocks were in melt down in 2000 and 2001 few people were focussed on the mining sector when that was in fact the single most important thing that investors should have been focussing on at that time. So, what will be the sector we should be focussing on this time? In order to work that out it may be useful to look at why mining diD so well in the early years of this millennium.

The price of commodities, like iron ore and coal, began rising in 2003 which was driven by demand from China and other Asian countries. We’d had low commodity prices for a decade and companies like Rio Rinto and BHP Billiton had been under-investing in new supply. No-one anticipated the surge in demand and the swift rise in prices. Iron Ore moved from $420 a tonne to $170/tonne while coal moved from $50/tonne to $180/tonne.
Commodities have a very capital-intensive supply chain and so in the short term the elasticity of supply is very low. Therefore, changes in demand have an exaggerated effect on price. By definition the sector investors should focus on will have been under-invested and also be likely to experience an increase in demand over the coming years.
Under-investment
A useful indicator to find an under invested sector may be poor stock market performance as poor performance will tend to deter investment.

Once again Mining and Industrial Metals have been among the worst performing sectors in this cycle, followed by food retailers and banks who haven’t recovered from the credit crunch. It pains me to think that exactly the same will happen this time as happened from 2003 but I guess it was technology that has driven the current boom in the same way as it did in the late 90’s.
Mining and Industrial metals
The Baltic Dry Index is an index which measures the cost of shipping goods around the world. It is a composite of 3 sub-indices that measure the cost of carrying goods in 3 sizes of dry bulk carriers or merchant ships: Capesize, Panamax and Supramax. As these ships take a long time to build the supply of extra shipping volume has a long lead time. As a result, the price of the shipping space is very sensitive to demand – which in turn is driven by global trade. Consequently, the price is often a lead indicator of world trade and can be very economically cyclical. In economic slumps ships are sometimes parked up in rivers while in economic booms they can be brought out of the river again. Beyond that it takes a long time to construct new vessels to expand the supply of carriers. It is a lead indicator of the health of the mining and shipping sector. The long-term chart of this index is charted below.

Source: Tradingeconomics
We can see from this chart the pick-up in the price in 2002 which led the price rises in commodities that started in 2003. We are seeing a similar pick up today. It would seem that the price today is not predicting a recession at a time when all the economists are glued to yield curve charts and shouting “recession indicator”. With long term interest rates at unprecedented low levels it may just be that economists are looking at the wrong indicator based on their formative years training in an era of higher interest rates. It certainly wouldn’t be the first time that economists have collectively got it wrong. Because this time prices are telling us there will be no global recession.
It is in fact precisely this fixation with yield curves that has been the theme of the last 10 years. Low interest rates combined with low growth has directed money into the hope of new technologies and internet business models changing the world, starving the industrial sector of investment. Instead money has been channelled into structural growth companies resulting in ludicrous over valuations of companies such as Wework, Beyond Meat and others.
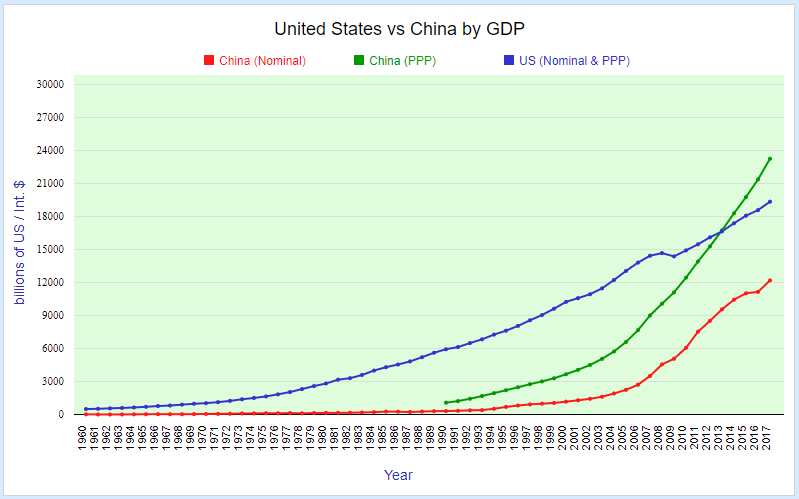
On the demand side post the tech bubble it was Asia and China demand that had been overlooked by markets and caused the surprise resulting in the mining boom. Now China’s GDP growth continues to exceed that of the US and it won’t be long before China is the largest global economy, a fact that President Trump is unlikely to take well.
Source: statisticstimes.com
We can see that China has already overtaken the US in terms of purchasing power parity (because goods are cheaper in China) but in nominal terms it will take longer to overtake the US. China has a population more than 4 times that of the US and as their wealth improves so will the goods they demand. The Chinese economy is 77% reliant on agriculture compared to 17% in the US meaning that the goods they demand are likely to be more basic materials than services in the US.
It is noticeable on the chart that recession in 2008 didn’t extend to China as their GDP continued to rise. In 2008 the US was heavily exposed to banking assets while China wasn’t and this time it is fair to say that China’s exposure to the unicorn sectors is also less than that of the US. The increasing wealth of China will lead to increasing demand Perhaps it will move from basic steel that is demanded to more sophisticated products. But they will still need to be shipped.
Conclusion
It pains me to suggest that the same will happen again and that mining and Industrial metals will lead the high performing sectors over the coming years the same way as it did last time. But the stage does look set for a repeat performance.
This gives us retail investors a problem of how to get exposure to this as we throw our hopes for software down the drain. The stocks are spread across 3 sectors.
In the Industrial transportation sector there is only Clarkson Plc which provides the closest to a pure play on ship broking that benefits from international trade. Many others such as Fisher (James) and Sons Plc has exposure to oil rigs etc which may decline as they are replaced by renewables. Clarkson’s results on 12 August noted “particularly strong trading” in the broking division and said “despite challenges remaining in the shipping, offshore and capital markets”. 77% of Clarkson’s revenues are derived from ship broking while it trades on a PE of 24.5X.
In the Industrial Metals Sector there are 11 quoted companies in the FTSE 350. Most of these companies are international and operate in exotic areas of the world carrying significant political risks which are unpredictable. For that reason I prefer to just invest in the largest which are more geographically diversified, BHP Group Plc (previously BHP Billiton) which has a £82bn market cap, and Rio Tinto Plc which has a £67bn market cap.
In Mining there are 4 stocks in the FTSE 350 – Hothschild Mining, Fresnillo, Centamin and Polymetal. Each of these is essentially a bet on a specific type of asset. Hothschild H1 profit this year fell on silver prices, as did Fresnillo while Centamin rose on improved gold prices and Polymetal is a ply on Palladium prices. None of these are really a play on the China trade.
Conclusion My preference therefore would be to take a look at Clarkson in the Industrial transport sector as a play on shipping volumes and prices while BHP Billiton and Rio Tinto both look like interesting plays on demand for basic resources from China. It is difficult to have any stock specific advantage on such large companies so I regard them as a play on the macro rather than any stock specific angle.
BHP and Rio Tinto
BHP


Rio Tinto


Source: SharePad
Rio Tinto is more a play on Iron Ore and Aluminium while BHP is largely Iron Ore and Copper. Whether China is set to consume more Copper than Aluminium I am not sure but BHP also has more exposure to petrol and coal which I wonder about as electric vehicles and renewable energy takes a larger share of global consumption. For that reason I am inclined to prefer Rio Rinto.
Valuations


Source: SharePad
Both companies’ share prices have traded in a similar pattern over the last 10 years and both have recovered from share price lows in 2016, underlining the futility of being a stock sector amongst large cap stocks. BHP has recovered more than 150% from its lows while Rio Tinto has recovered c. 140%.
BHP today trades on a forecast PE of 9.8X and yield 6.9%. Rio Tinto trades on a PE of 8.1X and yields 8.5%. So both stocks are cheap with god yields but more likely an investment in these stocks will be a play on earnings driven by commodity prices rather than valuation.
Capex
It is noticeable that the companies cycle of capital expenditure appears to be closely related to the share price graphs above with a low in 2016. Naturally companies will invest more as confidence improves.
BHP Group Plc

Rio Tinto Plc

Source: SharePad
If we compare that to the Baltic Dry Index we can see that it also reached a low in 2016.

Source: Trading economics
Which may suggest the future looks bright.
Balance Sheets
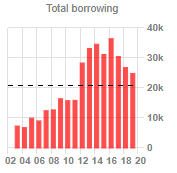
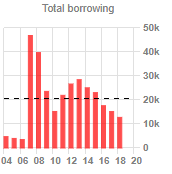
BHP has been reducing its borrowing since 2016 while Rio Tinto’s debt has been declining from before the bottom of profitability in 2016. Both companies have modest gearing.
BHP Group Plc
Rio Tinto Plc
Source: SharePad
Conclusion
Both these companies are lowly valued, on 9.1X and 8.4X earnings respectively while they look like they are at the bginning of a new cycle. We have missed the bottom in 2016 but if the Baltic Dry Index is a lead indicator there is more to come and we may have another super cycle which will inevitably result in valuation uplifts as capital gets redirected from technology sectors to industrial sectors. I find it hard to prefer one stock above another other but I wonder about the future of BHP’s coal and petroleum assets.
For those who prefer a trading play Clarksons may also benefit.
Clarkson Plc
Share Price 2848p
Mkt Cap £863m
Business
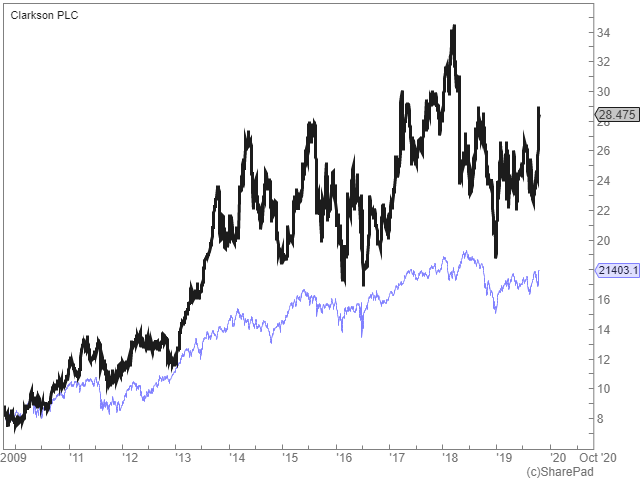
This is an old ship broking form founded in 1852. Today it has 1600 employees across 50 offices in 23 coutries and operates out of 4 divisions. It is a cash generative business but the flip side is the earnings are unpredictable and can be impacted by trade wars, natural disasters, and economic cycles. Over recent years the company has expanded by acquisition outside of its core area of ship broking into Research, Capiatal Markets, and support. With 77% of the revenues still coming from broking this remains the principal driver. The 10 year share price graph, plttes aginst the FTSE 250 below, underlines the variability of the earnings.
Source: SharePad
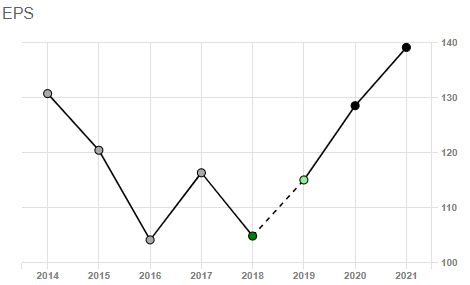
The company did extremely well as trade recovered post the financial crisis but has under performed the FTSe 250 since 2014. The reason is clear:
Source: SharePad
Analysts always tend to be over optimistic on a stock such as this when estimating earnings because they are not as close to the markets as the company.
Valuation
For Dec 2019 the PE is 24.7X, falling to 22X Dec 2020. And for that reason I would suggest the shares are discounting the next two years growth.
Personal View
This is a cyclical business and while the incease in the Baltic Dry index recentlly suggests optimism the potential uplift in earnings looks priced into the shares. The time to buy this cyclical stock is bravely – during a recession.
Summary
The economists are all watching yield curves that suggest a recession, while the Baltic Dry Index is not suggesting a downturn in trade. Meanwhile markets have gone sideways for some time and the gloom is reaching a crescendo as Woodford Investment Management closes its business. There is a lot of gloom, which is a time for investor optimism. The style of the cycle will change. Everything I can find says it will be mining and industrial transport again as China growth continues. While the crescendo of negativity to small and illiquid stocks attracts my investment nose. This looks like a time that investors would be well served to ensure their diversification strategy includes both small caps and mining.
Forthcoming Events

Source: Website, Estimate
This article is for educational purposes only. It is not a recommendation to buy or sell shares or other investments. Do your own research before buying or selling any investment or seek professional financial advice.

Weekly Commentary: 21/10/19 – A New Era Dawns
A New Era Dawns
Often it is easy to be so pre-occupied with the present that we miss the elephant quietly sauntering past the boardroom windows. The focus on Woodford Investment Management closing its doors over the week end was deafening. It will no doubt continue on BBC Panorama at 8.30 tonight when it airs an investigation of the fund management industry. I can’t help but feel it may be more productive to focus on what opportunities this may throw up instead. Often, at points of change, the opportunity is in exactly the asset class that it is popular to denigrate. Tony Dye, a renowned value investor of the 1990’s, was released from Phillips & Drew in February 2000 on account of his sticking to a value style precisely one month before the peak of the technology bubble. I can’t help but wonder if this is another one of those moments that seem to come when there is a change in style and investors need to reappraise their sector allocations.
As the rhetoric around small and illiquid stocks reaches a crescendo, they are starting to outperform. Last week the small cap index outperformed the FTSE 100 by 2.6% – an indicator of a turning point.
It will be a long time until the typical fund management Chief Investment Officer takes the “house” view that illiquid stocks are a good place to be meaning that any change in will take a long time. But share prices anticipate trends rather than lag trends and as investors the best returns are available to those that anticipate.
The chart below – which appeared in this note two weeks ago – shows how easy it is to miss the elephant in the room. When technology stocks were in melt down in 2000 and 2001 few people were focussed on the mining sector when that was in fact the single most important thing that investors should have been focussing on at that time. So, what will be the sector we should be focussing on this time? In order to work that out it may be useful to look at why mining diD so well in the early years of this millennium.
The price of commodities, like iron ore and coal, began rising in 2003 which was driven by demand from China and other Asian countries. We’d had low commodity prices for a decade and companies like Rio Rinto and BHP Billiton had been under-investing in new supply. No-one anticipated the surge in demand and the swift rise in prices. Iron Ore moved from $420 a tonne to $170/tonne while coal moved from $50/tonne to $180/tonne.
Commodities have a very capital-intensive supply chain and so in the short term the elasticity of supply is very low. Therefore, changes in demand have an exaggerated effect on price. By definition the sector investors should focus on will have been under-invested and also be likely to experience an increase in demand over the coming years.
Under-investment
A useful indicator to find an under invested sector may be poor stock market performance as poor performance will tend to deter investment.
Once again Mining and Industrial Metals have been among the worst performing sectors in this cycle, followed by food retailers and banks who haven’t recovered from the credit crunch. It pains me to think that exactly the same will happen this time as happened from 2003 but I guess it was technology that has driven the current boom in the same way as it did in the late 90’s.
Mining and Industrial metals
The Baltic Dry Index is an index which measures the cost of shipping goods around the world. It is a composite of 3 sub-indices that measure the cost of carrying goods in 3 sizes of dry bulk carriers or merchant ships: Capesize, Panamax and Supramax. As these ships take a long time to build the supply of extra shipping volume has a long lead time. As a result, the price of the shipping space is very sensitive to demand – which in turn is driven by global trade. Consequently, the price is often a lead indicator of world trade and can be very economically cyclical. In economic slumps ships are sometimes parked up in rivers while in economic booms they can be brought out of the river again. Beyond that it takes a long time to construct new vessels to expand the supply of carriers. It is a lead indicator of the health of the mining and shipping sector. The long-term chart of this index is charted below.
Source: Tradingeconomics
We can see from this chart the pick-up in the price in 2002 which led the price rises in commodities that started in 2003. We are seeing a similar pick up today. It would seem that the price today is not predicting a recession at a time when all the economists are glued to yield curve charts and shouting “recession indicator”. With long term interest rates at unprecedented low levels it may just be that economists are looking at the wrong indicator based on their formative years training in an era of higher interest rates. It certainly wouldn’t be the first time that economists have collectively got it wrong. Because this time prices are telling us there will be no global recession.
It is in fact precisely this fixation with yield curves that has been the theme of the last 10 years. Low interest rates combined with low growth has directed money into the hope of new technologies and internet business models changing the world, starving the industrial sector of investment. Instead money has been channelled into structural growth companies resulting in ludicrous over valuations of companies such as Wework, Beyond Meat and others.
On the demand side post the tech bubble it was Asia and China demand that had been overlooked by markets and caused the surprise resulting in the mining boom. Now China’s GDP growth continues to exceed that of the US and it won’t be long before China is the largest global economy, a fact that President Trump is unlikely to take well.
Source: statisticstimes.com
We can see that China has already overtaken the US in terms of purchasing power parity (because goods are cheaper in China) but in nominal terms it will take longer to overtake the US. China has a population more than 4 times that of the US and as their wealth improves so will the goods they demand. The Chinese economy is 77% reliant on agriculture compared to 17% in the US meaning that the goods they demand are likely to be more basic materials than services in the US.
It is noticeable on the chart that recession in 2008 didn’t extend to China as their GDP continued to rise. In 2008 the US was heavily exposed to banking assets while China wasn’t and this time it is fair to say that China’s exposure to the unicorn sectors is also less than that of the US. The increasing wealth of China will lead to increasing demand Perhaps it will move from basic steel that is demanded to more sophisticated products. But they will still need to be shipped.
Conclusion
It pains me to suggest that the same will happen again and that mining and Industrial metals will lead the high performing sectors over the coming years the same way as it did last time. But the stage does look set for a repeat performance.
This gives us retail investors a problem of how to get exposure to this as we throw our hopes for software down the drain. The stocks are spread across 3 sectors.
In the Industrial transportation sector there is only Clarkson Plc which provides the closest to a pure play on ship broking that benefits from international trade. Many others such as Fisher (James) and Sons Plc has exposure to oil rigs etc which may decline as they are replaced by renewables. Clarkson’s results on 12 August noted “particularly strong trading” in the broking division and said “despite challenges remaining in the shipping, offshore and capital markets”. 77% of Clarkson’s revenues are derived from ship broking while it trades on a PE of 24.5X.
In the Industrial Metals Sector there are 11 quoted companies in the FTSE 350. Most of these companies are international and operate in exotic areas of the world carrying significant political risks which are unpredictable. For that reason I prefer to just invest in the largest which are more geographically diversified, BHP Group Plc (previously BHP Billiton) which has a £82bn market cap, and Rio Tinto Plc which has a £67bn market cap.
In Mining there are 4 stocks in the FTSE 350 – Hothschild Mining, Fresnillo, Centamin and Polymetal. Each of these is essentially a bet on a specific type of asset. Hothschild H1 profit this year fell on silver prices, as did Fresnillo while Centamin rose on improved gold prices and Polymetal is a ply on Palladium prices. None of these are really a play on the China trade.
Conclusion My preference therefore would be to take a look at Clarkson in the Industrial transport sector as a play on shipping volumes and prices while BHP Billiton and Rio Tinto both look like interesting plays on demand for basic resources from China. It is difficult to have any stock specific advantage on such large companies so I regard them as a play on the macro rather than any stock specific angle.
BHP and Rio Tinto
BHP
Rio Tinto
Source: SharePad
Rio Tinto is more a play on Iron Ore and Aluminium while BHP is largely Iron Ore and Copper. Whether China is set to consume more Copper than Aluminium I am not sure but BHP also has more exposure to petrol and coal which I wonder about as electric vehicles and renewable energy takes a larger share of global consumption. For that reason I am inclined to prefer Rio Rinto.
Valuations
Source: SharePad
Both companies’ share prices have traded in a similar pattern over the last 10 years and both have recovered from share price lows in 2016, underlining the futility of being a stock sector amongst large cap stocks. BHP has recovered more than 150% from its lows while Rio Tinto has recovered c. 140%.
BHP today trades on a forecast PE of 9.8X and yield 6.9%. Rio Tinto trades on a PE of 8.1X and yields 8.5%. So both stocks are cheap with god yields but more likely an investment in these stocks will be a play on earnings driven by commodity prices rather than valuation.
Capex
It is noticeable that the companies cycle of capital expenditure appears to be closely related to the share price graphs above with a low in 2016. Naturally companies will invest more as confidence improves.
BHP Group Plc
Rio Tinto Plc
Source: SharePad
If we compare that to the Baltic Dry Index we can see that it also reached a low in 2016.
Source: Trading economics
Which may suggest the future looks bright.
Balance Sheets
BHP has been reducing its borrowing since 2016 while Rio Tinto’s debt has been declining from before the bottom of profitability in 2016. Both companies have modest gearing.
BHP Group Plc
Rio Tinto Plc
Source: SharePad
Conclusion
Both these companies are lowly valued, on 9.1X and 8.4X earnings respectively while they look like they are at the bginning of a new cycle. We have missed the bottom in 2016 but if the Baltic Dry Index is a lead indicator there is more to come and we may have another super cycle which will inevitably result in valuation uplifts as capital gets redirected from technology sectors to industrial sectors. I find it hard to prefer one stock above another other but I wonder about the future of BHP’s coal and petroleum assets.
For those who prefer a trading play Clarksons may also benefit.
Clarkson Plc
Share Price 2848p
Mkt Cap £863m
Business
This is an old ship broking form founded in 1852. Today it has 1600 employees across 50 offices in 23 coutries and operates out of 4 divisions. It is a cash generative business but the flip side is the earnings are unpredictable and can be impacted by trade wars, natural disasters, and economic cycles. Over recent years the company has expanded by acquisition outside of its core area of ship broking into Research, Capiatal Markets, and support. With 77% of the revenues still coming from broking this remains the principal driver. The 10 year share price graph, plttes aginst the FTSE 250 below, underlines the variability of the earnings.
Source: SharePad
The company did extremely well as trade recovered post the financial crisis but has under performed the FTSe 250 since 2014. The reason is clear:
Source: SharePad
Analysts always tend to be over optimistic on a stock such as this when estimating earnings because they are not as close to the markets as the company.
Valuation
For Dec 2019 the PE is 24.7X, falling to 22X Dec 2020. And for that reason I would suggest the shares are discounting the next two years growth.
Personal View
This is a cyclical business and while the incease in the Baltic Dry index recentlly suggests optimism the potential uplift in earnings looks priced into the shares. The time to buy this cyclical stock is bravely – during a recession.
Summary
The economists are all watching yield curves that suggest a recession, while the Baltic Dry Index is not suggesting a downturn in trade. Meanwhile markets have gone sideways for some time and the gloom is reaching a crescendo as Woodford Investment Management closes its business. There is a lot of gloom, which is a time for investor optimism. The style of the cycle will change. Everything I can find says it will be mining and industrial transport again as China growth continues. While the crescendo of negativity to small and illiquid stocks attracts my investment nose. This looks like a time that investors would be well served to ensure their diversification strategy includes both small caps and mining.
Forthcoming Events
Source: Website, Estimate
This article is for educational purposes only. It is not a recommendation to buy or sell shares or other investments. Do your own research before buying or selling any investment or seek professional financial advice.