
In this month’s funds column, David Stevenson weighs up whether US equities are truly in an AI bubble and highlights funds and asset classes that can diversify away from concentrated US tech. He also questions the proposed HICL/TRIG merger, favours INPP, and explores the fast-emerging opportunity in defence-focused SpaceTech.
Are US equity markets in an AI bubble? If so, which assets and funds are least correlated with US equities and offer the best diversification potential? How are well-known global equity fund managers navigating a challenging, concentrated market? If AI stumbles, is SpaceTech ready to take on the challenge? These and other questions are discussed in this month’s funds article. Additionally, we suggest the proposed HICL/TRIG merger is a poor idea and that investing in rival infrastructure fund INPP might be a better option.
AI Bubbles, diversification and valuation
It’s impossible not to ask: is AI in a bubble, and are valuations out of control for US tech leviathans? Personally, I’d answer no, though I say that with no great certainty. My focus is rather on increasing the diversification of my investments – I prefer to adopt the precautionary principle and be underweight US assets, even if that proves to be a terrible choice and AI stocks continue to surge.
But I am absolutely no expert on AI, so I will defer to those who are much better paid and work for giant investment banks in the US to answer that question. One of the best papers I’ve seen on the topic is from Goldman Sachs, which argues that whilst equity valuations have risen substantially. Market concentration has reached extreme levels, key differences distinguish current conditions from historical bubbles.
The biggest five US technology companies now represent 16% of the entire global public equity market, with the top ten accounting for nearly 25%, worth almost $25 trillion. However, three critical factors differentiate today’s market from past bubbles: the technology sector’s appreciation has been driven by fundamental growth rather than irrational speculation, leading companies possess strong balance sheets, and the AI sector continues to be dominated by a few established companies rather than the frenzied new entrant competition typical of bubbles.

The GS paper notes that technology sector earnings growth has been extraordinary relative to all other sectors, particularly since the financial crisis, with this fundamental performance justifying much of the price appreciation. The median 24-month forward P/E ratio across the Magnificent Seven stands at 27x, roughly half the equivalent valuation of the largest seven companies in the late 1990s, while EV-to-sales ratios remain much lower than those commanded by dominant companies during the dot-com peak. Multiple valuation methodologies, including PEG ratios, price-to-book versus ROE comparisons, and dividend discount models, all suggest valuations are stretched but not yet at bubble levels.
That said, Goldman Sachs acknowledges concerning developments, including IPO and M&A acceleration, with starting day premiums reaching 30% in the US, the highest since the late 1990s technology bubble, and signs of retail speculation

Capital expenditure has also surged dramatically, with hyperscalers projected to spend $432 billion in 2026, double the $239 billion spent in 2024. However, unlike the 1990s telecom bubble financed heavily through debt, today’s dominant companies finance capex primarily through free cash flow, maintaining robust balance sheets with cash representing 2.7% of market cap on aggregate and net debt-to-equity at negative 22%.

The report notes the increasing emergence of debt financing, with $141 billion in corporate credit issued by technology companies so far this year, surpassing the $127 billion issued in all of 2024. Normalising liquidity positions amid increased capex appetite represents potential concerns, though Goldman’s credit strategists emphasise that today’s big tech balance sheets remain strengthened by high cash flows and low leverage. Banks’ strong balance sheets further reduce likelihood of systemic effects from any technology sector de-rating.
Goldman Sachs recommends maintaining a continued focus on diversification, given the high market concentration and increasing competition from AI. I’d absolutely echo that point myself.
So far, so good – GS doesn’t seem to be that bearish on US equities or an AI bubble.
However, it is worth noting that the Goldman Sachs strategist who correctly predicted Wall Street’s underperformance this year, expects US equities to continue lagging other markets for the next decade. Peter Oppenheimer and his team expect the S&P 500 to achieve annual returns of 6.5% over the next 10 years, which is the weakest among all regions. Emerging markets are projected to be the strongest, with a growth rate of 10.9% per year.

After a decade of constantly superior performance, driven by a surge in technology stocks and the craze for artificial intelligence, the S&P 500 has lagged behind global peers this year. The benchmark has climbed 16%, compared with the 28% rally in a worldwide MSCI index that excludes the US. In the coming years, Oppenheimer and his team expect emerging-market gains to be driven by strong earnings growth in China and India. Goldman Sachs has this advice for long-term investors: “Diversify beyond the US, with a tilt toward emerging markets.”
That seems a sensible conclusion to me.
Diversification options
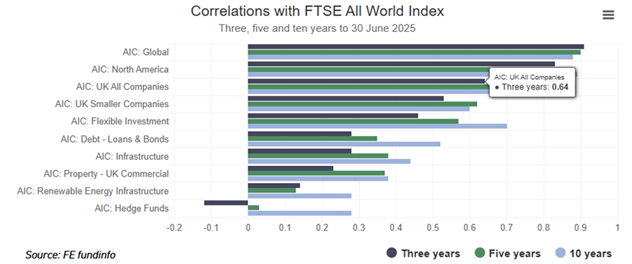
How do you diversify away using funds in the UK? That cues up a useful analysis by Bowmore Wealth Group, an independently owned business based in London and Bristol that specialises in financial planning and investment management.
They’ve crunched a large dataset to identify asset classes with low correlation to global equities. Here are the results, with the data points representing correlations over 3, 5, and 10 years.
· Infrastructure-focussed investment trusts over three, five and 10 years have correlation scores of 0.28, 0.38 and 0.44, respectively
· Renewable energy infrastructure over three, five and 10 years has correlation scores of 0.14, 0.13 and 0.28
· Commercial property 0.23, 0.37, 0.38
· Hedge funds -0.12, 0.03 and 0.28 – “making them the least correlated asset class to the FTSE All World Index”
· Bonds 0.28, 0.35, 0.52
· UK equities 0.64, 0.7, 0.67
· Global equities 0.9 over three, five, and ten years
My central takeaway ? Alternative investment trusts have real diversification value within a portfolio.
Thoughts on the HICL/TRIG merger – buy INPP
The big news story in the UK investment trust sector this month is the proposed combination of HICL and TRIG to create an investment company with net assets of c. £ 5.3 bn.
The transaction is structured as a reconstruction and voluntary winding-up of TRIG under Guernsey law. TRIG’s assets will transfer to HICL in exchange for newly issued HICL shares and an optional cash component. The combined entity will target an NAV TR of at least 10%, over the medium term, and will target an initial dividend target of 9.0 pence
New HICL shares will be issued to TRIG shareholders on a formula asset value-for-formula asset value basis, using each company’s 30 September 2025 NAV as the reference point. On the latest numbers, the indicative exchange ratio is 0.714173 HICL shares per TRIG share.
On many levels, this merger makes sense within the broader context of the investment trust sector, which is busy with consolidation. It certainly makes sense for the managers as well as TRIG shareholders who can swap out deeply discounted shares for shares in a merged fund with a (hopefully) lower combined discount.
I also believe there are advantages to a larger scale for the combined entity and to utilising HICL’s steady cash flows to finance a new wave of broader infrastructure investments. That said, I’m much less convinced that this is a good deal for HICL shareholders, who will receive shares in a riskier combined vehicle that invests in a much broader range of assets – although to be fair, HICL has been investing in riskier economic infrastructure assets for some time now.
My own concerns are echoed by veteran investment trust fund manager CG Asset Management who are appalled by the proposal. CG reckon that..
1. this is an exceptionally poor transaction for HICL, and
2. in aggregate this proposal is value destructive.
“We can see no strategic rationale for the transaction. TRIG’s portfolio and HICL’s portfolio are invested in entirely different asset classes and their combination will not result in material cost savings. If investors wish to have exposure to both these asset classes they can easily do so by buying shares in both TRIG and HICL. However, many investors, like us, have made an explicit decision not to be invested in TRIG and have no desire to be forced to do so by the board of HICL.”
Earlier last week, they followed up with a group letter from a more exhaustive list of HICL shareholders, which argued that:
• structuring the merger on a FAV to FAV basis undervalues HICL’s assets relative to TRIG’s;
• TRIG’s September NAV does not reflect the increased uncertainty surrounding the RO and FiT subsidy regimes caused by the October UK government consultation;
• renewable energy trusts continue to experience negative momentum in their NAVs unlike HICL which is achieving NAV growth;
• if HICL shareholders want to achieve renewable energy exposure they can do so at lower cost by purchasing shares in the relevant company in the market;
• third party transactional evidence provides stronger support to validate HICL’s NAV than it does for TRIG’s;
• all material transaction terms including voting thresholds and cash out options favour TRIG shareholders over HICL shareholders;
• the proposed merger will result in increased fund level gearing;
• the proposed merger is not generating material cost savings;
• if this merger occurs InfraRed Capital will avoid a continuation vote at TRIG, improving their position. In summary, it appears the principal beneficiary of this proposal is the manager, the second beneficiary are the shareholders of TRIG. Shareholders of HICL are left to suffer.
The devil will be in the details, but for now, the obvious move for me is for HICL investors to either watch and wait if the proposal succeeds or switch now to INPP shares. International Public Partnerships will be the only pure-play classic infrastructure fund left if this deal goes through, combining HICL and TRIG. I rate the management behind INPP highly, and I suspect that investors will warm again to its investment appeal: it trades at a 22% discount well above its 52-week average and offers a well-backed yield of 73%.
The next big thing: National Defence SpaceTech
Given all the excitement about AI and huge American tech players, I thought I might focus on something a bit more homegrown and European-focused: SpaceTech. Space X gets all the publicity – deservedly – but there’s a vast array of space tech businesses, many of which are based in Europe, and some of which are owned by UK fund managers. Crucially, there’s a huge structural change happening under our noses. Space technology is being transformed into the next frontier of the national security/defence state. Companies that were once focused on using satellites to track carbon emissions, for instance, are pivoting to using satellites. That has already had a huge impact on one UK-listed venture capital investment trust, Seraphim Space Investment Trust, in which I hold shares and continue to increase my holdings.
A few weeks ago, in mid-October, an FT article revealed that Iceye, Seraphim’s largest holding, is exploring raising funding at a c. $ 2.5bn (c. £ 1.88 bn) valuation. Seraphim, ticker SSIT, holds something like 5 to 10% of ICEYE, and in the March accounts for the fund, it implied it was holding ICEYE at an implied EV of c.$1,122m. According to the same FT article, ICEYE manufactures around 25 satellites annually and aims to raise this to 100-150.
An update from the fund a few days later in October disclosed the NAV per share for the fund overall at 118.5p as of 30 June 2025, up 23% over the FY period and 18% over Q2 (calendar), driven entirely by a revaluation of ICEYE. The holding increased by approximately 72% quarter-on-quarter to £105m (from £61m), contributing approximately 18.5p of NAV uplift, effectively accounting for the entire increase in the quarter. ICEYE is now c.37% of SSIT’s NAV (c.2.8x MOIC).
Fund analysts at Panmure Liberum report that ICEYE came to prominence after using its radar satellites to track Russian troop movements toward Ukraine ahead of the 2022 invasion. According to Sifted, ICEYE has built the world’s largest SAR satellite constellation, and its pivot into defence has materially accelerated its growth:
“Back in June…. ICEYE expected to double its revenue to over €200m in 2025, driven by increasing demand for its Earth observation satellites and SAR data from governments and defence customers. ICEYE has secured strategic partnerships with Saab and NATO, enhancing both its commercial and defence positioning.”
ICEYE continues to see strong defence demand, including a $168m agreement with the Finnish Defence Forces during the period, and collaborations with Rheinmetall and IHI (Japan) to deploy constellations for defence and civil uses.
And ICEYE is far from the only portfolio company seeing an uptick in demand for its defence-related product set. Holdings with defence applications include ICEYE, ALL.SPACE, D-Orbit, SatVu, Spire Global and Argit in Europe, and HawkEye 360, LeoLabs and Xona Space outside Europe.
Last week, Seraphim Space announced its first-quarter results (up to 30 September 2025) with NAV rising slightly from £281.1m to £283.6m quarter-on-quarter. There was a slight drop in the value of the largest holding, ICEYE, following the recent uplift, but the fund also benefited from gains across its other top holdings, especially a strong increase in HawkEye 360 (the fourth-largest investment, 10.4% of NAV), which grew by £9m (+44%) to £29.6m. HawkEye 360 operates a commercial LEO constellation collecting RF signals from space, enabling detection, characterisation, and geolocation of activities previously invisible. Defence demand is strengthening as geopolitical tensions rise and early-warning capabilities
As I write this note, SSIT’s shares trade at 78p, up just 12% over the last six months. That implies a 36% discount to NAV. That strikes me as unrealistic. The shift to defence applications doesn’t just affect the ICEYE holding – many of SSIT’s portfolio companies are moving into the military sector. Across both the US and Europe, defence technology firms listed on stock markets, such as Palantir, trade at high valuations, but SSIT still trades at a significant discount. I believe it’s quite possible that SSIT could reach over 125p per share if the market perceives more progress and the fund begins to realise some of its holdings.
I agree with Panmure Liberum’s broad analysis, which estimates that space defence revenues will grow rapidly, with a c.17.9% CAGR in defence-focused space investing globally, rising from $71bn in 2024 to more than $300bn by 2033. They reckon that defence budgets are expanding faster than GDP, and unlike previous cycles, capital is now flowing through private suppliers and NewSpace companies building EO, PNT, communications and in-orbit infrastructure.
More broadly, I’d also draw readers’ attention to an interesting paper titled “Space : The next investable frontier” released by UK and European small-cap equities fund manager Montanaro. This follows on from earlier, similar research by the Seraphim Space Investment Trust, which looked at how space and military technology are converging, available here.
What’s noticeable is that this new report is from a fairly mainstream equities house – admittedly more small-cap based – writing seriously about the emergent space tech sector. That’s a positive sign for me and reinforces my very bullish stance on Seraphim. It’s worth highlighting one section of the report, a list of the publicly quoted Space Tech companies available in Europe.
Montanaro’s list of (public) Space Tech Companies to watch
· MDA Space is a Canadian-listed Small & MidCap company providing critical technologies across satellite systems, robotics and Earth observation
· Filtronic is a UK quoted Small & MidCap company specialising in high-performance radio-frequency, microwave and millimetre-wave technologies
· Cohort is a UK quoted Small & MidCap defence and technology group providing advanced systems and services for national security, intelligence and communications.
· Avio is an Italian-listed Small & MidCap company and one of Europe’s few pure-play launch providers.
· Astroscale is a Japanese-listed Small & MidCap company pioneering in-orbit servicing and space sustainability.
· Planet Labs is a US listed Small & MidCap company operating the world’s largest fleet of Earth Observation satellites.
You can download the Montanaro report HERE
Watching Alliance Witan and its outlook on global equities
I’ll finish with a quick deep dive into the latest numbers from Alliance Witan, a big global equities fund that is rightly popular with many UK investment trust buyers. It invests across geographies with a slight value tilt. It also uses individual sub-managers to invest in different geographies, with the overall asset allocation framework set by WTW, a big international investment consultancy. The table below shows the current geographical and sector allocations of the Alliance Witan investment trust compared to its benchmark, the MSCI ACWI index.
I find this comparison valuable, as the Trust is one of the largest, most active, and most popular global equity managers, combining top-down active asset allocation decisions with bottom-up stock selection across its underlying managers. I view it as a valuable measure of what active equity managers collectively believe we should invest in.
Note the significant underexposure to North America and an overweight exposure to the UK market (highlighted in red below). Also, look at the underexposure to IT and the overexposure to industrials. I’d agree with this view of the world. Diversify, diversify and diversify!

David Stevenson
Twitter: @advinvestor
This article is for educational purposes only. It is not a recommendation to buy or sell shares or other investments. Do your own research before buying or selling any investment or seek professional financial advice.


“Note the significant underexposure to North America and an overweight exposure to the UK market (highlighted in red below). Also, look at the underexposure to IT and the overexposure to industrials. I’d agree with this view of the world. Diversify, diversify and diversify!”
thinks this back to front which makes more sense – uk is underweight as a value mkt with zero catalyst, us is overvalued growth, cheap value which makes it neutral for rebalancing, emerging markets is growth of the future with emerging middle class drivers and tech is 4th industrial revolution overlaying everthing hence overweight
Hi Thanks for the comment. I’m not sure I agree with you. Alliance Witan is very clearly overweight the UK vs the relevant benchmark. Its managers are also aggressively value-focused, and the fund is not overweight emerging markets in any meaningful sense.
Hi David,
I think there is something wrong/missing:
“Companies that were once focused on using satellites to track carbon emissions, for instance, are pivoting to using satellites” doesn’t make sense to me?
Good spot Ian. yes you are right. It should have read
Companies that were once focused on using satellites to track carbon emissions, for instance, are pivoting to using satellites for defence purposes
HICL has lost 30% of its share price since 2022.
INPP has lost 24% of its share price since 2022.
Why would I put money into either of them????
Hi Ian
Thanks for the comment. Just so you know, I don’t say I am excited about HICL’s share price at the moment. I am much more interested in INPP. In total return terms, according to Deutsche Numis INPP, has gained 1.8% over the last 3 years, lost 1% over the last five years and gained 49% in total return terms over 10 years. The short-term returns haven’t been great (far from it), but they are not as bad as you imply. There is a fair chance the discount will narrow and that’s why I favour INPP.