Ever since Trump came back into power, the dynamics of the global stock market have changed. US equities are now flirting with a bear market, while European equities continue to power ahead. Even Chinese equities are outperforming US equities, and we’ve seen the Mag7 become less magnificent as the European defence sector surges ahead. These and more are the subject of this month’s funds overview. But we start with a quick deep dive into one of my favourite deeply discounted infrastructure funds, one that’s a bit different because it’s in the data space.

Cordiant Digital Infrastructure powers ahead
The listed infrastructure funds space has been a disaster in recent years. Rising interest rates dampened investor enthusiasm, and many funds, particularly in the renewables sector, struggled to meet their ambitious income targets. Unsurprisingly, many funds now trade at huge discounts, but those discounts aren’t always deserved. This month, I thought I’d focus on my favourite alternative fund, which boasts a more growth-oriented profile, i.e., where there’s real potential to grow the earnings profile of the operating businesses as well as the dividend. The fund is called Cordiant Digital, and it sits near the top of most of my research lists- I also own shares in the fund.
Put simply, I think it’s the cheapest way to buy well-managed, diversified exposure to digitisation as an infrastructure theme, with businesses in the portfolio spanning from data centres to mobile phone towers and digital broadcasting—all sub-sectors that typically attract sky-high valuations. Cordiant, as a fund, remains affordable, partly because it has suffered in association with its main rival, Digital 9 Infrastructure, which has had a tumultuous time over the past few years (something of an understatement).
Cordiant is making all the right moves: its management has been actively buying shares, and the company has steadily increased its well-covered dividend yield. Its latest third-quarter trading statement, released on Monday, offered another upbeat assessment of its rapidly maturing portfolio of digital assets. The key headline: the fund announced portfolio revenue and EBITDA growth of 9.6% and 13.6%, respectively, over the nine months to December 31, 2024.
Here are some key metrics from the update:
- Aggregate portfolio company EBITDA for the nine months to 31 December 2024 increased by 13.6% to £115.6 million on the prior comparable period … driven by contributions from contract wins, recent bolt-on acquisitions, cost control and the beneficial effects of contractual and other price escalators on revenue.
- Aggregate portfolio company revenue increased 9.6% to £241.9 million during the nine months to 31 December 2024
- The dividend target for the financial year to 31 March 2025 of 4.2p is 4.8x covered by EBITDA and 1.8x covered by free cash flow after Company-level costs, net finance costs, taxation and maintenance capital expenditure
- The portfolio revenue mix has diversified further, with the largest segment (now backbone fibre) accounting for 37% of total pro forma revenue and the portfolio’s largest country exposure, Poland, accounting for 33%.
- The Company and its portfolio companies collectively have no material debt maturities before June 2029, i.e. there is no short- or medium-term refinancing risk in the portfolio.
- As of 31 December 2024, the Company had total available liquidity of £211.7 million. This comprised total available cash at the Company and portfolio company levels of £78.3 million and total undrawn facilities of £133.5 million. This implies the fund has enough capital to fund new capex (a key challenge)
- Gross drawn debt, on a full look-through basis, was £655.1 million, resulting in aggregate net debt of £576.8 million. The Company’s leverage is 4.0x, calculated as aggregated net debt divided by LTM EBITDA as of 31 December 2024. By comparison, many companies in the digital infrastructure sector have leverage ratios in the 6-7x range.
- Steven Marshall, Executive Chairman and Co-Head of Cordiant Digital Infrastructure Management, made further purchases of shares, taking his aggregate direct holding to 11.7 million shares as of the date of this trading update. The Directors, Steven Marshall, the Investment Manager and employees of the Investment Manager now, in total, own 2.0% of the Company’s ordinary shares as of this trading update, compared to 1.8% as reported in the interim results in November 2024.
I’d highlight some of my key takeaways from this trading update:
- Improved Geographical and sector diversification: The fund was previously overly reliant (in my view) on Eastern Europe, but it now has a 32% exposure to Ireland, as well as 6% to Belgium and 5% to the USA. In terms of products, there’s also a better mix between fibre optic backbone and digital broadcast
- Real Skin in the game: Steve Marshal has around £10m invested in the fund, a material investment by any standard
- Discount has tightened from the mid-40% to the current 34%. I would target a 25% discount short to medium term
- Well-backed dividend yield at just under 5%
- Debt is manageable at 38% of gross asset value and is mainly fixed interest at cheap rates.
- It has enough cash to invest in new capex for the business
My bottom line: I stand by my suggestion that this is a core alternative fund, well-run, with a sound balance sheet, and exciting growth prospects in a sector that is only going one way (though that does assume continuous capital expenditure to keep up with developments such as AI).
European rearmament
The share prices of European defence giants have skyrocketed in the last few months. If you own shares in, say, Rolls-Royce or BAE, you should probably thank your lucky stars that Trump has so severely (and idiotically in my view) undermined confidence in NATO. His unorthodox foreign policy has prompted massive soul-searching in European capitals and sparked a colossal defence spending binge, with Germany leading the way. In my view, this marks the beginning of a decade-long bull cycle with significant investment potential, and it will benefit many sectors in Europe, particularly the major defence companies. Given this backdrop, I’d draw attention to a new fund launch: European ETF issuer Wisdom Tree has launched the WisdomTree Europe Defence UCITS ETF (WDEF), which seeks to track the price and yield performance, before fees and expenses, of the WisdomTree Europe Defence UCITS Index. The ticker for the GBP share class is WDEP, and the total expense ratio of this exchange-traded fund is 40%. Here’s a quick description by the fund manager of what it will do:
“The proprietary index is designed to track the performance of European companies involved in the defence industry, which includes manufacturers of civil defence equipment, parts or products, defence electronics and space defence equipment. The index seeks to exclude companies that are involved in controversial weapons banned by international law, such as cluster munitions, antipersonnel landmines, and biological and chemical weapons, as well as companies that violate the UNGC (United Nations Global Compact) standards. WDEF is the first of its kind focused solely on European defence companies. Following decades of underinvestment, European nations are committed to increasing defence budgets to meet the North Atlantic Treaty Organisation’s (NATO) 2% GDP target, with many already exceeding it. The increase in European defence spending reflects a strategic pivot towards addressing modern threats and ensuring regional security. This shift creates long-term opportunities in areas such as defence manufacturing, technological innovation, and space defence, offering significant growth potential for both established companies and emerging entrants in the industry.”
The current top ten holdings in this ETF include the following:
- Rheinmetall AG 20.47%
- Leonardo Spa 15.08%
- Saab Ab-B 9.83%
- BAE Systems PLC 9.65%
- Thales SA 8.77%
- Rolls-Royce Holdings PLC 6.55%
- Safran SA 5.31%
- Airbus SE 5.21%
- Kongsberg Gruppen AS 4.82%
- Melrose Industries Plc 2.45%
The fund is less than three weeks old, and yet it’s already boasting $554m in net new flows in its first two weeks of trading and currently has $511m in assets under management. Thus, readers probably won’t be surprised to discover that the average PE of the businesses in the fund is currently 39! Therefore, the stocks in this ETF are expensive, given their current and historical earnings.
For more information about the fund, visit the fund page HERE.
Chinese equities
It’s slightly ironic, but one of the few safe havens in the new Trump world of more tariffs consists of Chinese stocks or equities. Leading local equity benchmarks, such as the CSI 300, as well as UK-listed Chinese equity funds, are showing positive gains year to date, despite the Trump administration’s ongoing imposition of tariffs on local exports. Chinese tech stocks have, of course, since the Deep Seek, been on a tear, and most strategists expect that at some stage, the Chinese government will unleash more fiscal firepower to jump-start what has been a stuttering economy, flirting at times with outright deflation.
So, if China appears to be a more appealing prospect for equity investors, what are the best stock market benchmarks to track performance, and which funds track these indices? But before we dive into the world of Chinese equities, it’s worth making a few (obvious) observations.
The first is that China and Chinese equities have some undeniable risks, not least poor corporate governance, the omnipotent power of the Chinese Communist Party (which remains very communist by any standard definition) and the clear and present danger that China might invade a peaceful democratic nation called Taiwan.
The other obvious statement is that Chinese equities remain cheap despite a strong rally in recent weeks and months. That’s almost certainly for good reasons, not least the abovementioned risks. The broad Chinese equity benchmarks—the MSCI China index and the CSI 300—have a PE (price to earnings) ratio between 13 and 17 times earnings, although some specialist Chinese tech indices trade at much higher valuations.
My own take on this balance of risks (lots) and valuations (low) is that I’m unenthusiastic about Chinese equities. However, even this cynic has to concede that completely ignoring China as a market carries three obvious risks: firstly, Chinese tech companies might surprise us (again, post Deepseek) with some startling advances that set off a momentum rally. The next significant risk is that China has a vast economy, is a major exporter, and is a massive market. Logic dictates some exposure, which for many investors has traditionally meant investing in firms like those in the luxury goods industry in the West that sell to China. The challenge with the “buy China” exporters strategy is that China is turning inward and shunning many Western firms, thereby circumscribing that investment strategy.
The last risk is that once the current bout of trade tiffs, tariffs, and geopolitical rows subsides, the Chinese government, aware of the dangers of deflation, will launch a massive economic stimulus programme to jump-start the economy.
Therefore, determining how to approach China presents investors with some complex and challenging decisions. My default position is to avoid the Marxist superpower, but I concede that some exposure to China might make sense at this particular moment, especially as global investors, burnt by falling US equities, seek out new homes for risk capital.
To help navigate the maze of options, I’ve reviewed the performance data for investment trusts, ETFs, and benchmarks that invest in Chinese equities, highlighting the main options, particularly in terms of equity indices to track or use as benchmarks. The two significant indices are
- The MSCI China Index captures large and mid-cap representation across China A shares, H shares, B shares, Red chips, P chips, and foreign listings (e.g., ADRs). With 580 constituents, the index covers about 85% of the Chinese equity universe. The index includes large-cap and mid-cap A shares at 20% of their free float-adjusted market capitalisation.
- The CSI 300 index, which comprises 300 of the large and mid-capitalization stocks traded on the Shanghai and Shenzhen stock exchanges.”
The fundamental difference between these indices lies in their design purpose. The CSI 300 was created primarily for domestic Chinese investors to track the internal market, while the MSCI China Index was designed with international investors in mind, incorporating criteria specifically relevant for global portfolio allocation.
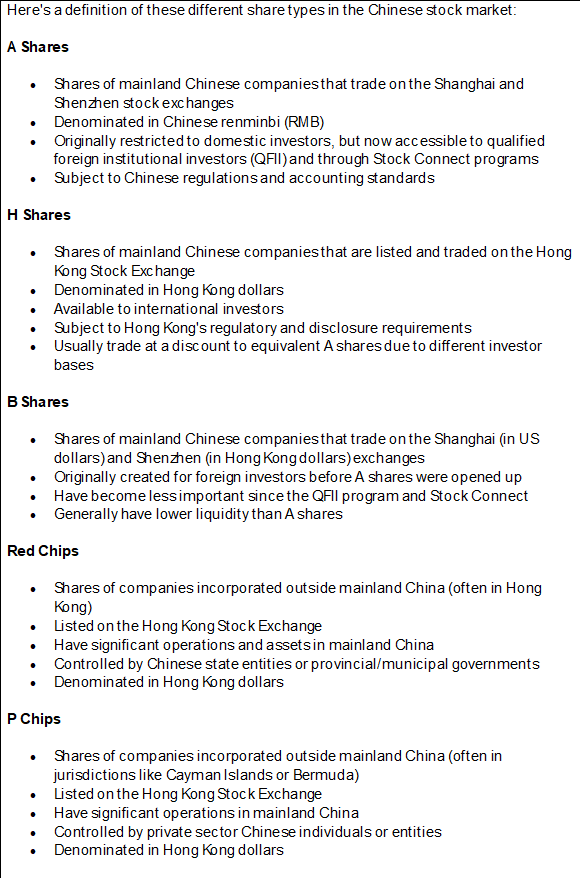
The MSCI China Index features a broad-based approach to capturing the Chinese equity universe. It covers large and mid-cap representation across multiple share classes, including China A shares, H shares, B shares, Red chips, P chips, and foreign listings such as American Depositary Receipts (ADRs) – see the table below for an explanation of these share types. With 580 constituents, the MSCI China index encompasses approximately 85% of the China equity universe, offering extensive market coverage. The index includes Large Cap A and Mid Cap A shares at 20% of their free float-adjusted market capitalization, reflecting a measured approach to mainland China exposure.
The comprehensive nature of the MSCI China Index makes it user-friendly for international investors seeking broad Chinese market exposure. Overseas listings and various share classes provide access to Chinese companies regardless of their listing location, creating a more globally oriented view of Chinese equity markets.
The CSI 300 Index takes a more focused approach, tracking specifically the 300 largest stocks by market capitalisation and liquidity from the universe of A-share companies listed on mainland China exchanges. This index was initially designed for domestic Chinese investors and exclusively includes Large-cap securities from the Shanghai and Shenzhen exchanges. The concentrated nature of the CSI 300 makes it a more direct reflection of mainland China’s domestic market dynamics. The CSI 300’s exclusive focus on A-shares means it captures only companies trading in local currency (Renminbi) on mainland exchanges. It provides a more localized view of the Chinese economy, but less representation of Chinese companies with international presence or those choosing to list overseas.
The MSCI China Index offers significantly broader coverage than the CSI 300. Its inclusion of multiple share classes and overseas listings gives it a more comprehensive representation of Chinese corporate activity globally. While both indices include large-cap securities, the MSCI China Index also incorporates mid-cap companies, providing exposure to a broader market segment.
Interestingly, the constituent overlap between these two indices is only 53%, highlighting substantial differences even when focusing on the same share class.
The first big table below shows the year-by-year price returns for a collection of ETFs tracking the significant indices alongside a handful of actively managed investment trusts that exclusively invest in local Chinese equities. As with other benchmark surveys, I have colour-coded the different ETFs and funds by year based on annual returns.
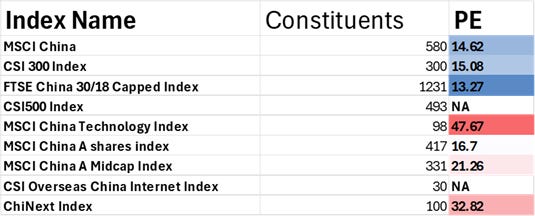
Let’s examine the main benchmarks first, starting with the table below. This compares the main Chinese equity benchmarks and shows considerable variation in the number of shares within an index and the underlying price-to-earnings ratio of the stocks (on average) in that benchmark. The number of constituents ranges from 30 mega-large-cap stocks in the CSI Overseas China Internet Index to 1230 in the FTSE China (30/18 version) index.
Looking at valuations, most of the broadest benchmarks trade at between 13 and 18 times earnings, although you probably won’t be surprised to discover that the most tech-oriented benchmarks, the MSCI China Technology index and the ChiNext index, trade at much higher valuations.
Benchmark characteristics
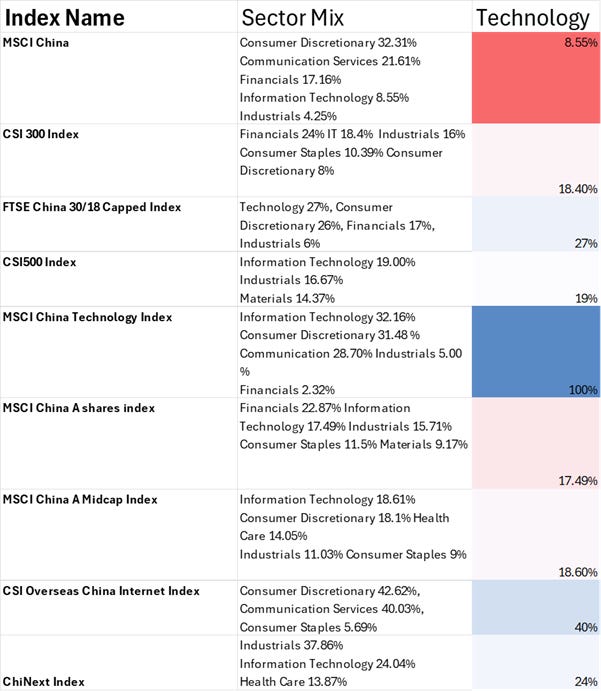
Switching to the sector mix, some interesting differences emerge. Compare the MSCI China index to its nearest rival, the CSI 300 index: the MSCI China A Index (and, by extension, the A-share component of the MSCI China Index) has a decreased weight in financials and an increased weight in growth sectors such as information technology and healthcare compared to the CSI 300.
This allocation difference makes the MSCI approach potentially more aligned with evolving economic trends in China, whereas the CSI 300 has historically maintained heavier exposure to traditional sectors like financials. In the table below, I’ve also included the broader range of benchmarks and a separate column showing the technology exposure for each index, with the MSCI China Technology index obviously completely exposed to tech stocks!
~
David Stevenson
Got some thoughts on this week’s article from David? Share these in the SharePad chat. Login to SharePad – click on the chat icon in the top right – select or search for ‘share chat’.
This article is for educational purposes only. It is not a recommendation to buy or sell shares or other investments. Do your own research before buying or selling any investment or seek professional financial advice.


