
Companies have three main choices when it comes to financing their business. They can use money from shareholders or equity, use the profits and free cash flows produced by the business, or they can borrow money from lenders.

Debt on its own is not a bad thing. If a company takes the money it has borrowed and invests it wisely in profitable projects then shareholders will get richer.
Problems with debt occur when a company borrows too much and ends up with too much interest to pay on its debts relative to its profits and cash flows.
As a shareholder, you should always be aware that lenders have to be paid before you. Interest on borrowings has to be paid before shareholders can get paid a penny.
If a company’s trading profits cannot cover the annual interest bill on debts then the company may become insolvent and shareholders can end up with nothing.
Paying attention to a company’s debt position is therefore something that all investors should do.
Debt suits some companies better than others
Companies with large stable profits and cash flows can support more debt than companies whose profits can move sharply up and down over an economic cycle.
This means that companies in sectors such as utilities, telecoms, consumer staples, food retail and those with large property assets (such as pubs) tend to be financed with reasonable amounts of debt without worrying their shareholders too much.
Debt magnifies the changes in profits and losses to shareholders through something known as financial gearing. High debts and big interest payments mean that profits for shareholders (after tax or net profits) can change more dramatically than a company’s trading profits.
Companies with high operational gearing – where high fixed operating costs mean that trading profits change by a greater extent than changes in revenue – should have very little financial gearing.
If you come across a company with high operational gearing with lots of debt you are exposing yourself to the risk of your investment being wiped out if trading falls off a cliff.
Debt Information in SharePad
Fortunately, SharePad has lots of information on a company’s financial position.
Below is a table created with companies from the UK leisure sector with some of the key items that you need to keep an eye on.
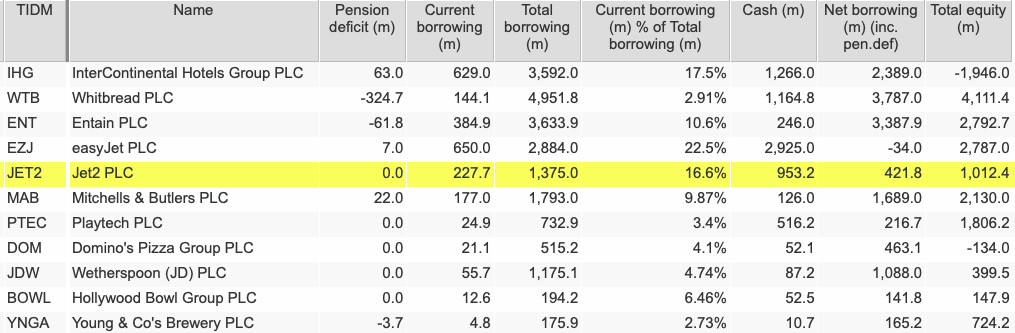
Pension deficits – the extent to which the liability to pay pensions based on an employee’s final salary is greater than the value of assets in the pension fund – used to be a hot topic amongst investors.
Deficits are a shortfall which the company will have to address if it persists. Payments to cover deficits are made before shareholders receive dividends which is why this financial liability is rightly seen as a form of debt.
Big pension fund deficits are less of an issue these days as most companies have closed their final salary pension schemes to existing employees. However, there are still some companies out there – such as BT – where the pension deficit is still an issue and takes cash flows away from shareholders.
Some companies are fortunate to have pension fund surpluses which is shown as a negative figure in SharePad.
SharePad allows you to look at the breakdown between current borrowing – debts which have to be repaid within one year at the last balance sheet date – and total borrowing.
Companies with a large chunk of their total debts that need to be paid back or refinanced within a year can be very vulnerable in a rising interest rate environment. This means that their interest cost when refinanced could be a lot higher than the company is currently paying which could reduce future profits.
You should also look at the cash balances and shareholders’ equity that are available to support a company’s debts.
Net debt versus gross debt
Many investors weigh up a company’s borrowings by looking at a number known as net debt or net borrowing. This is simply a company’s total borrowings (preferably including any pension deficit) minus its cash balance.
The problem with netting off cash balances is that the figure concerned is only a snapshot taken on the balance sheet date. A company’s average cash balance throughout the year can or may be very different to what it is at the year-end.
Assuming that all the company’s cash balances can be used to repay debts might also be wishful thinking.
For example, a company can delay paying its suppliers until after the end of its financial year. This can lead to it having a high cash balance on its balance sheet date. However, it might then use a large chunk of this cash to pay the suppliers the following day which means that using net debt as a measure of a company’s financial position may not be wise.
It might be better to look at gross or total borrowings instead. In reality, only truly excess cash – cash that is not needed to fund the day-to-day running of a business – can be used to repay debts and it’s not easy for outside investors to work out what this figure might be.
Companies also have a tendency to choose a year-end balance sheet date which shows their cash balances and net borrowings in their most favourable light.
This is why lots of travel companies have September year ends when customers have paid for their holidays but perhaps the company has not yet paid the hotels for their stay yet.
SharePad allows you to see differences in debt and cash balances at different times in a company’s financial year as you can use half-year or quarterly balance sheet data items.
In the table below, you can see that easyJet’s borrowing and cash balances were markedly different at its last half year in March compared with its year-end in September.
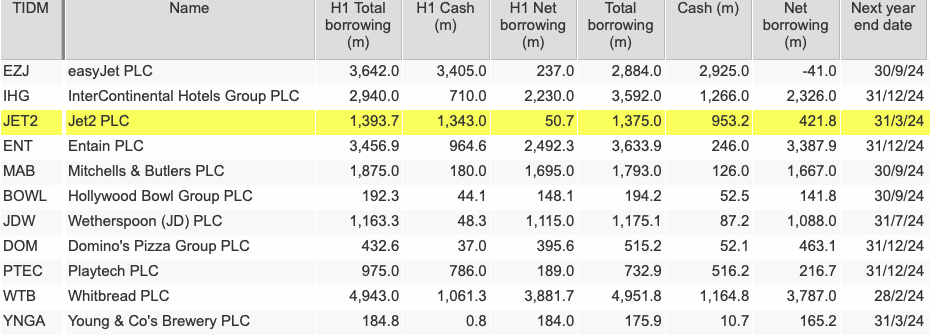
Jet2’s borrowings were fairly similar at its half-year and full-year balance sheet dates. However, its cash balance was higher and net borrowing was lower at its half-year in September – when it is sitting on large summer holiday payments – than at its full year-end.
Many retailers who make a large chunk of their profits in the run-up to Christmas will have December year-ends. Some care therefore might be needed when interpreting its year-end debts and financial position.
Using debt ratios in SharePad
SharePad allows you to weigh up a company’s debt using a large selection of financial ratios.
When it comes to measuring a company’s financial strength, the interest cover ratio which is calculated by dividing trading profits by the net interest payable is arguably the best.
This is because it is based on a company’s performance throughout a time period rather than at the end of a period or balance sheet date.
The higher a company’s interest cover, the easier it is for it to pay its interest bill and the lower the risk faced by shareholders.
Netting off interest received from interest payable is very questionable as a company pays gross interest on its debts in practice. A better calculation of interest cover might be to add interest receivable to trading profit and then divide that number by interest payable.
Alternatively, you can take a company’s free cash flow before interest (free cash flow to the firm or FCFF) and divide it by cash interest from the cash flow statement. This can sometimes give you lower levels of interest cover than using numbers from the income statement and may be more conservative.
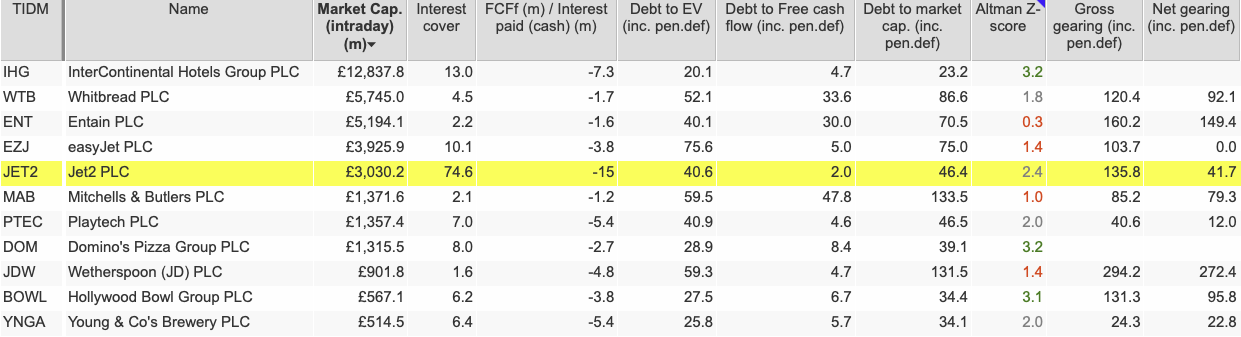
You can also look at gross debt levels to a company’s enterprise value (EV) or market capitalization where the higher the percentage, the more indebted a company is.
Gearing, which compares debt levels to shareholders’ equity as a percentage is another common measure of indebtedness. You can see that often gross gearing – which ignores cash balances – is much higher than net gearing and gives a different view of financial risk.
The Altman Z-Score uses a number of financial ratios to calculate a company’s risk of bankruptcy. Strong companies will have a score of 3.0 or more, whereas a score of 1.8 or below puts the company in the danger zone.
Is Net Debt to EBITDA a flawed ratio?
Many investors and lenders use the net debt to EBITDA (earnings before interest, tax, depreciation and amortisation) ratio to measure how quickly a company can pay back its debts. It is probably the most common debt ratio you will see in financial commentary on a company.
The big issue is whether a company can really use its EBITDA to repay debt as interest, tax and stay-in-business investment (depreciation can be a useful estimate of this) are not really optional in the long run.
Debt to free cash flow may therefore be a better measure of how quickly a company can repay its debts.
~
Got some thoughts on this week’s article from Phil? Share these in the SharePad chat. Login to SharePad – click on the chat icon in the top right – select or search for a specific share.

This article is for educational purposes only. It is not a recommendation to buy or sell shares or other investments. Do your own research before buying or selling any investment or seek professional financial advice.


