
Former Investment analyst and financial journalist Phil Oakley shows how he uses ShareScope to research companies and shares.

I have been using ShareScope since it was launched in 2015 and helped to develop many of the features that are in it today. It remains a great resource for private investors and I find it invaluable when researching investments for my own portfolio but also for my work as a financial journalist.
ShareScope is definitely a case of the more you use it, the more you get out of it. Over the years, I have developed and changed how I set it up to get the insights I am looking for.
There is so much that you can do with ShareScope that I could probably write a book about it. For the purposes of this article, I will stick to the key tools and data that I use in my research process.
Getting started
Once I have decided on a company to research I look at it through various data tables and charts that I have built over time.
Building a data table is quite straightforward. You select from the list of shares, click on “Setting” in the bottom left-hand corner of your screen and then select the “Create New” option.
Once you have done this, you then select from the vast choice of data that ShareScope has available to build your table. If you intend on using this table regularly you can add it to the toolbar at the bottom of the page.
Over the years, I have built dozens of data tables to help me with my research and work. The ones that I go back to again and again are based on the following areas of analysis:
- Profitability
- Cash flow
- Financial Strength
- Growth
- Valuations
- Total Returns
Analysing Unilever with ShareScope data tables
Let’s have a look at consumer goods giant Unilever with some custom-built data tables.
To get more of an insight, I also start off by selecting “restrict sector” and the FTSE All Share list to see how Unilever compares with similar companies listed on the UK stock market.
Profitability
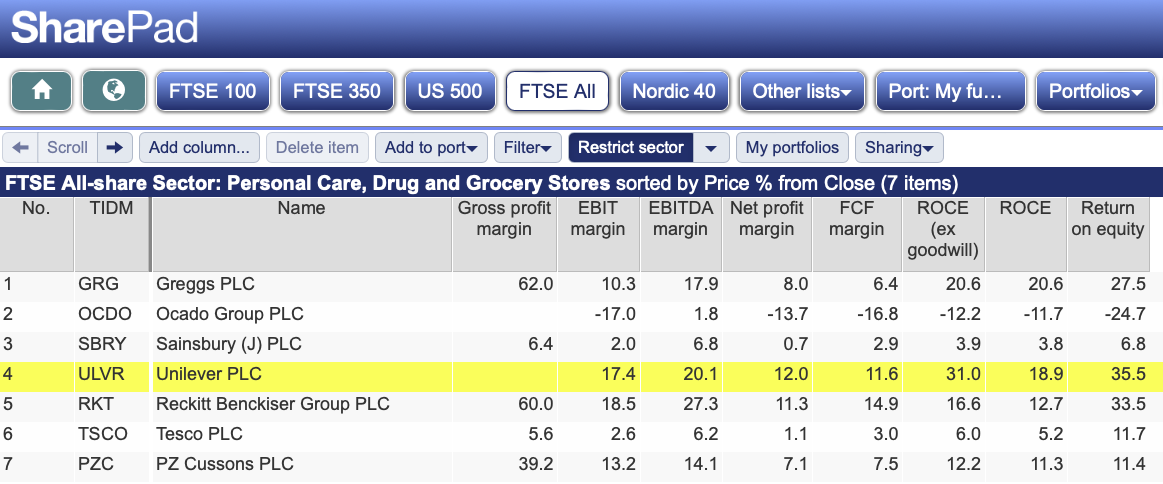
Missing data often reflects a company that has recently reported where certain data items may not be available
Here we have a range of profit margins and returns data which shows that Unilever is a very profitable business.
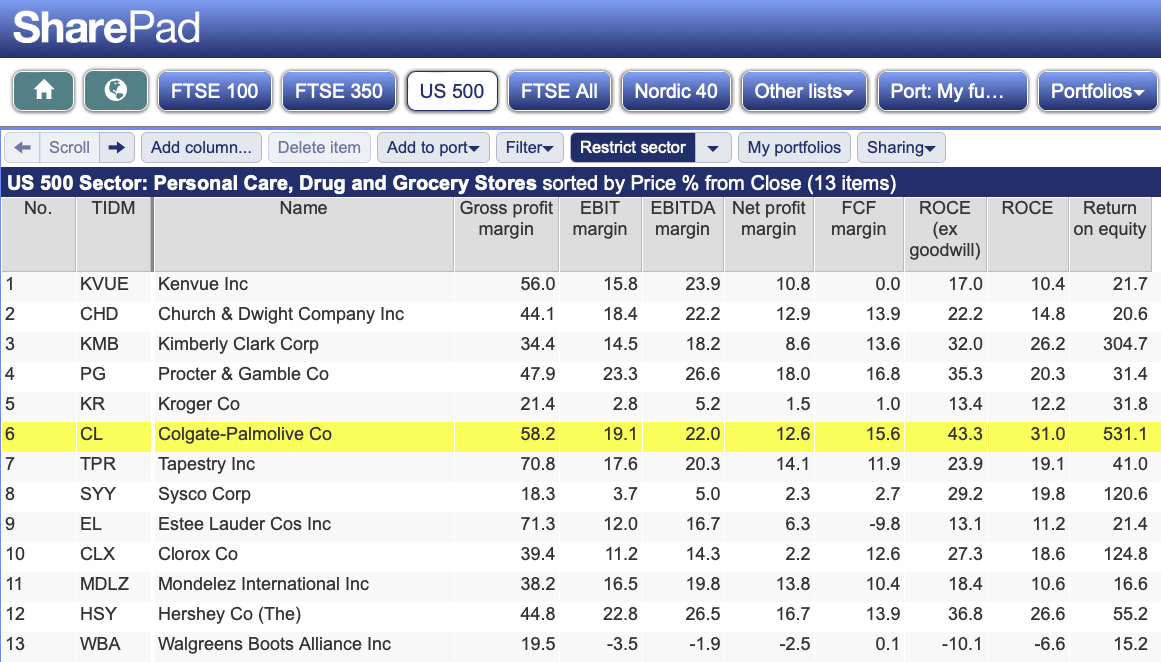
If you want to see how Unilever stacks up against its US peers, you can simply select the US 500 list tab and you will get the data.
This table gives you some insight into past profitability but what about the future?
Future profitability
ShareScope’s comprehensive historic and forecast data allows you to look at a company’s estimated future profitability and compare it with long-term trends such as a 5-year or 10-year average.
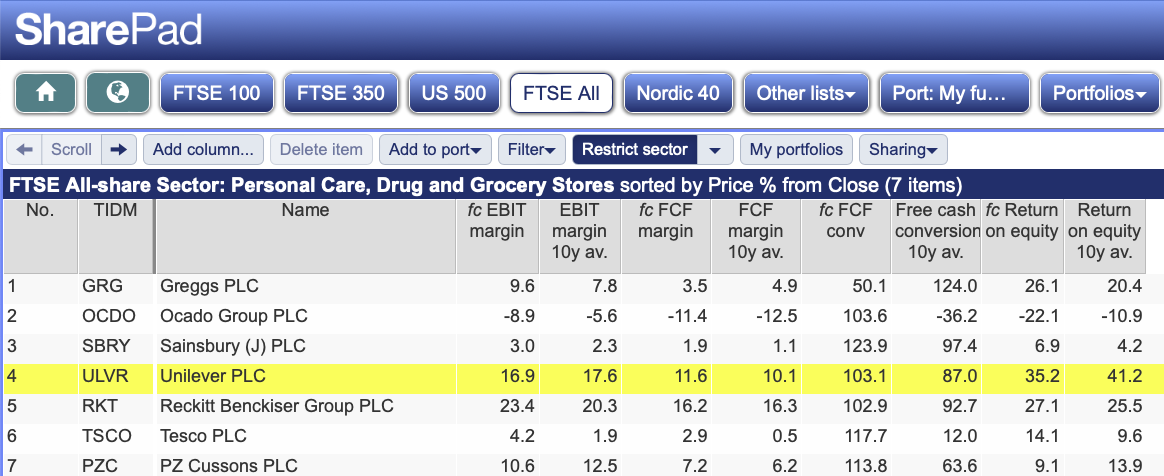
Here we can see that Unilever’s profit margins and return on equity are expected to be slightly lower than its 10-year average but its free cash generation is expected to be better.
Cash Flow
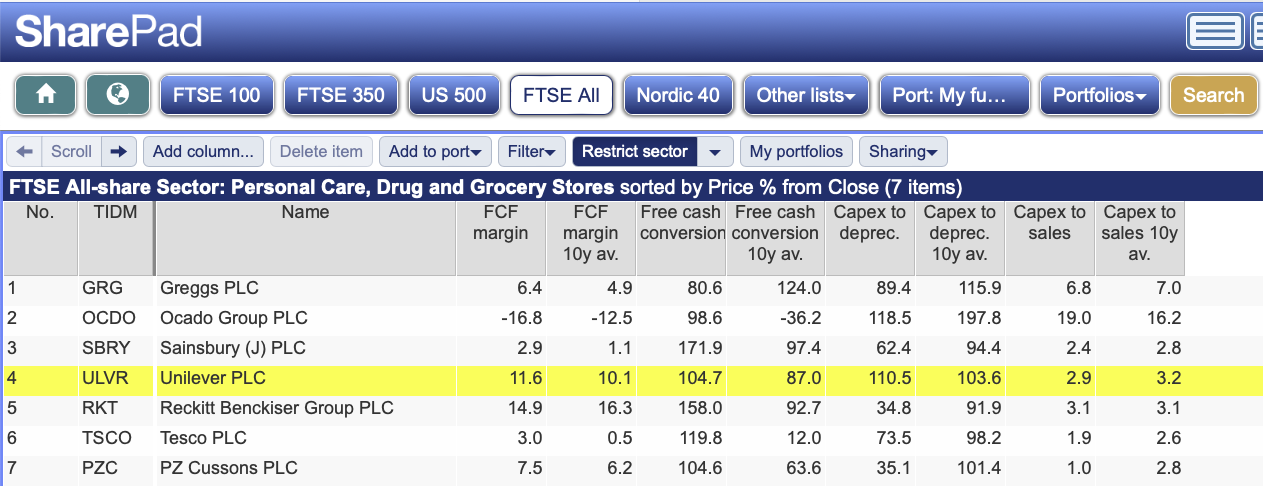
An overview of Unilever’s cash generation can be seen in more detail here.
We can see that it has been pretty good at turning its profits into free cash flow over the last decade (always a welcome sign) but that Reckitt Benckiser has been better at turning its revenues into free cash flow with higher free cash flow margins.
Financial Strength
Investing in companies with strong financial positions is a good way to reduce risk for investors. Again, ShareScope can give an insight into predicted key financial ratios such as interest cover, net debt to EBITDA and net debt to free cash flow.
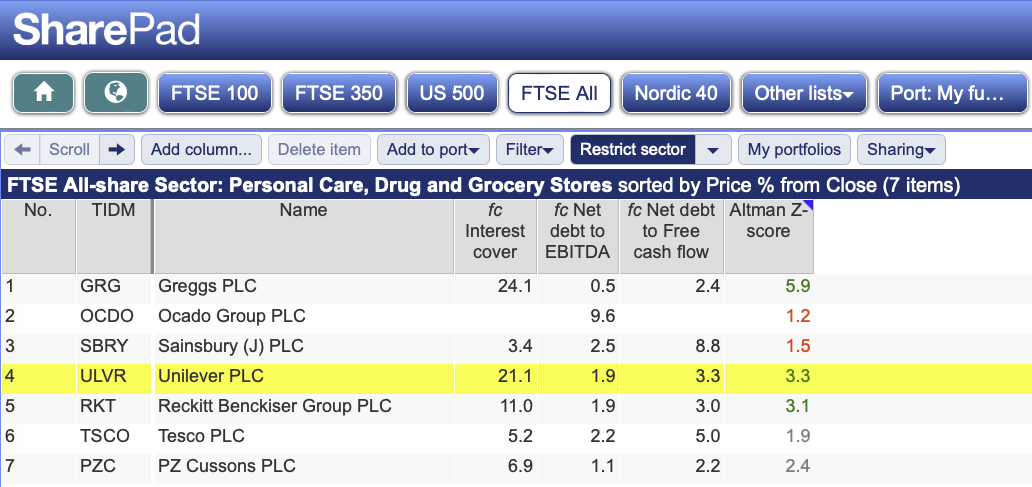
Unilever scores well here with very high levels of predicted interest cover (the number of times its trading profits can pay its annual debt interest expense) and free cash flow which could repay its net debt in just over three years.
Growth
Growth is the magic ingredient needed for companies to become more valuable over time. Without it, investors are less likely to have a profitable investment in a company’s shares.
ShareScope gives great insight into a company’s historic and predicted growth across a number of variables such as turnover(revenue), earnings per share (EPS) and dividends per share (DPS).
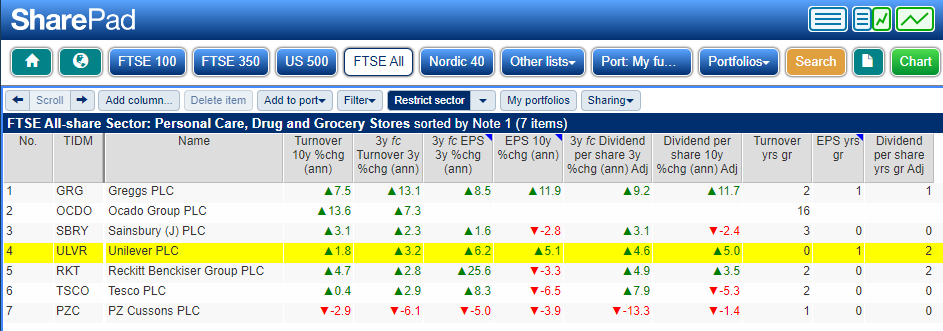
Unilever has not been a particularly high-growth company over the last decade and that is not expected to change much over the next three years.
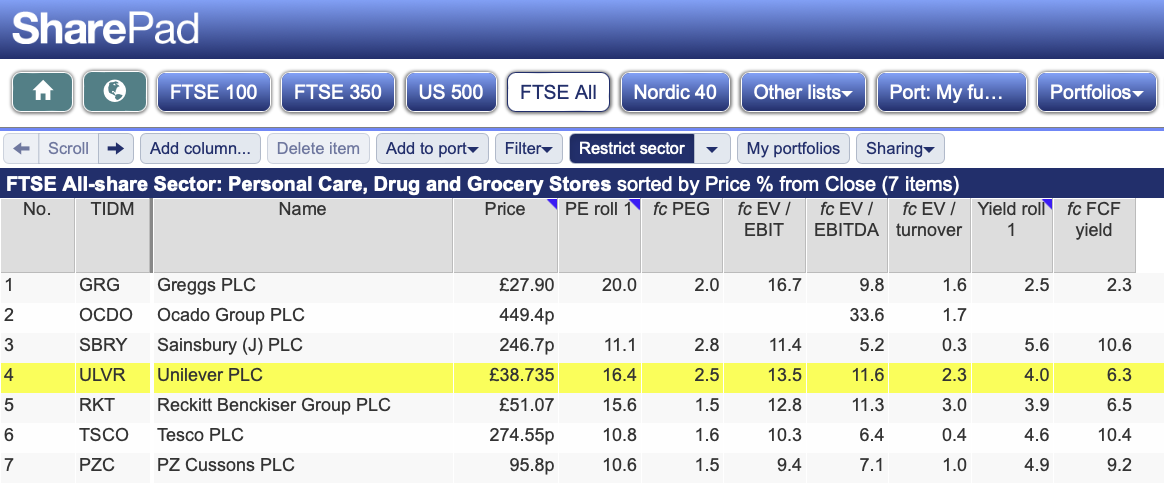
Valuation
Unilever shares are more expensively valued relative to most of its peers. They have a reasonably high dividend yield but companies such as Tesco have a higher yield and higher-than-expected dividend growth.
Total Returns
Past returns may not be a good predictor of future returns, but they give a good insight into sentiment towards a share.
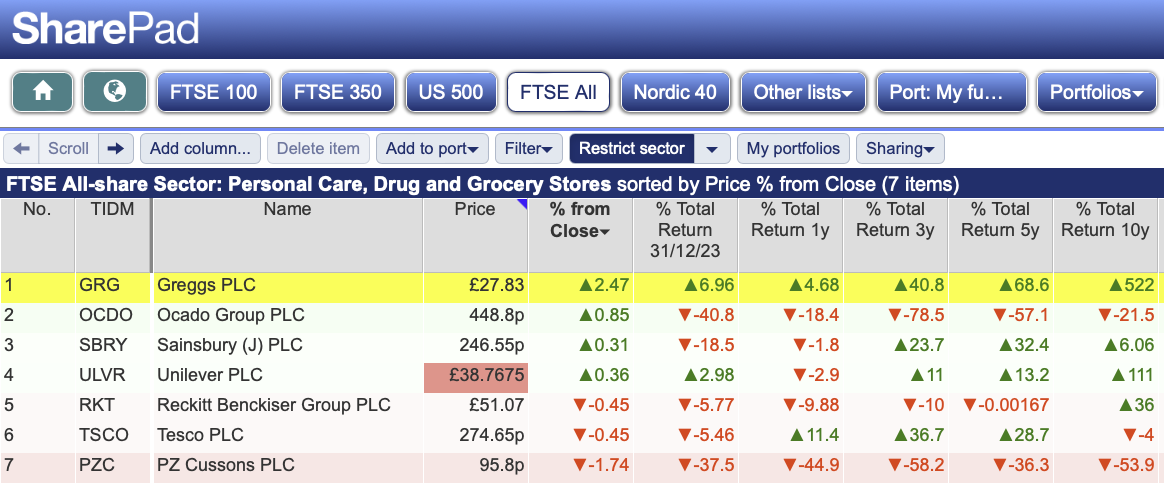
Unilever’s total returns to shareholders (the change in its share price plus dividends received) over the last decade have been satisfactory but quite disappointing over the last five years.
Given that its valuation is not particularly cheap and its expected growth nothing to write home about, the case for arguing that future returns will be meaningfully higher is not a strong one right now.
Financial Charts
In addition to data tables, I use ShareScope’s impressive financial charting capability to get a quick and valuable insight into a company.
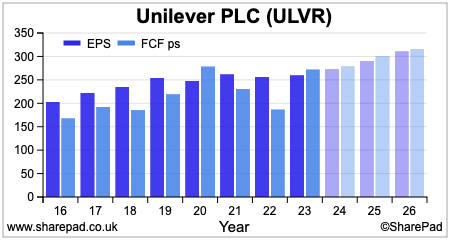
Here I can see that its profit margins have been fairly consistent and are expected to remain so.
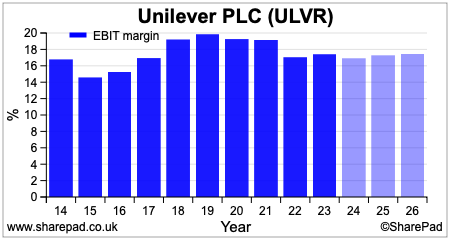
The company is also expected to continue converting most of its profits (EPS) into free cash flow.
This is only a very brief overview of some of the things that I use ShareScope for, but I hope readers find it useful.
Phil Oakley
Got some thoughts about this article? Share these in the comment section below.
Not subscribed to ShareScope before? Click below to find out how ShareScope can make you a better investor.
This article is for educational purposes only. It is not a recommendation to buy or sell shares or other investments. Do your own research before buying or selling any investment or seek professional financial advice.


