
This month we track down the listed investment funds which are still trading near their 52-week discount peaks and take a closer look at the worst offender in this category – the Digital 9 Infrastructure trust which is on the receiving end of yet more bad news. Not all big discount funds are worth the risk, but we do look at around a dozen funds that might warrant more research. Plus, Japanese equities are on a roll but the best bet remains hedging your currency risk. And uranium prices continue to rise, drawing attention to the growing number of investment vehicles focused on this niche space.

It’s still grim for plenty of listed funds
The listed funds’ segment, dominated by investment trusts, has had a grim old year or so as sentiment has turned against the sector, especially listed alternative and infrastructure funds. One way of measuring this negative sentiment is to look at the number of funds that are at or within spitting distance of their 52-week discount lows i.e funds whose current discount is as high as it’s been for the last 52 weeks or year. This numbered well over 50 at one stage but more recently this had dwindled to under 10.
Sadly, in the last few weeks, that number has started creeping up again – Nvidia and the Magnificent Seven may be steaming ahead but UK investors remain defiantly cynical about many investment trusts. It’s important to say that just because a fund is trading at a 52-week low, that doesn’t mean it’s a good investment – far from it in fact as many funds deserve their chunky discounts. But some decent funds are kicking around in the list below and I’ve added some comments next to them. In this exercise, I’ve expanded the definition to also include funds that are either exactly at their 52-week low discounts or within a per cent or two of that 52 discount peak. By my calculations, I can see at least 24 funds that fit this grim definition and half of them make it onto my list below.
I freely admit that some of the funds below are very risky and deeply unloved – I’d put D9, Ceiba (a Cuban property fund), and Hipgnosis Songs in that category. There are also some property funds – notably Schroder European Real Estate and Life Sciences REIT – which are victims of negative sentiment towards REITS generally. But some of the funds strike me as dirt cheap and high quality – in that category I would put RIT Capital Partners, Cordiant Digital Infrastructure, and Menhaden Resources. As for infrastructure funds, sentiment is still clearly very negative with plunging power prices and continued high interest rates, but Pantheon Infrastructure and Renewable Infrastructure Group look very reasonably priced to me, presuming that you are willing to be a patient investor and can wait until there is a turn in sentiment.
| Fund | Discount | 52-week low discount/premium | Comment? |
| Digital 9 Infrastructure | -82.9 | -82.9 | See below – on my buy list |
| CEIBA Investments (Cuban real estate) | -69 | -68 | Interesting but highly speculative |
| Hipgnosis Songs | -54.8 | -54.8 | Controversial fund with difficult-to-value assets but may be good value, eventually |
| Life Sciences REIT | -48.1 | -48.1 | This fund looks cheap and is in an interesting space |
| Cordiant Digital | -45.1 | -47.2 | Quality play, dirt cheap, one of my favourite bargain funds |
| Schroder European Real Estate | -39.9 | -41.8 | Quality euro property play |
| Menhaden Resources Efficiency Trust | -38.3 | -39.5 | Dirt cheap collection of high-quality sustainable large-cap stocks. A bargain |
| RIT Capital Partners | -25.1 | -27.6 | High-quality public-private markets hybrid play. Long time City favourite and cheap at the moment |
| Pantheon Infrastructure | -25 | -27.3 | High-quality generalist infrastructure fund |
| Renewables Infrastructure Group | -26.5 | -27 | First-rate infra fund. Long-term quality play |
| VinaCapital Vietnam Opportunities | -24.4 | -25.1 | Great play on one of the most exciting economies in the world. Invests in public and private equities |
| Riverstone Credit Opportunities | -20.4 | -20.8 | Well-run income play but sub scale and facing continuation vote |
A Junior Miners ETF launches
Regular readers of these funds’ articles will know that I am a long-term bull on uranium and uranium mining stocks. My core contention is that uranium spot prices will continue to increase as demand for uranium oxide by power producers around the world picks up while supply constraints kick in in the short term. If you’re looking for a more detailed analysis of the case for uranium I would recommend research by alternative assets firm Ocean Wall – their analysis of Uranium Risks & Rewards is first class.
The simplest way to buy into this space is through a vehicle called YellowCake, an AIM-listed investment company that owns a physical stockpile of uranium oxide (yellowcake) in Canada, in a secure facility. This is one of a handful of firms that own the physical assets, the other being Canadian fund manager Sprott which runs a big US-listed physical uranium tracker fund with the ticker SPUT.
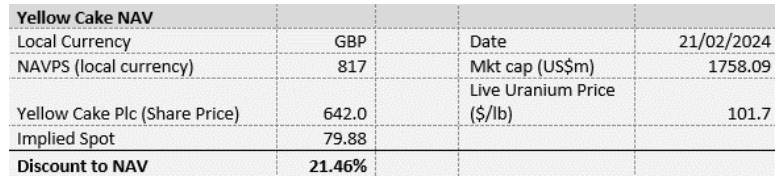
Many uranium investment vehicles trade at a significant discount to their net asset value – SPUT in the US for instance is on an 11.38% discount. Ironically, as the spot price of Uranium has carried on increasing these discounts have widened out. YellowCake’s discount is now at 21%. The table below from Ocean Wall details how this discount for YellowCake is worked out – as they say, you’re paying less than $80 per lb of uranium oxide even though the spot price is well above $100 a lb.
The other way of playing the uranium space is to invest in uranium mining equities, whose share price is closely geared to the spot price, although I would note that many miners deliver their output via long-term contracts to power producers. At the moment, the best way to play Uranium mining equities is either to buy a big-name single stock such as Cameco or the UK-listed investment trust Geiger Counter, which owns Cameco as well as other names in the space, notably NexGen Energy (23% of the fund vs Cameco at 10%). This actively managed fund from CQS has had a cracking few months and is still trading at a sizeable discount to NAV (at least 13% based on the last fact sheet). It is still small by fund size – around £100m – and has a large to mid-cap focus, although it does hold some smaller-cap stocks.
Geiger Counter will soon have competition from an ETF launch in the form of the first Junior Uranium Miners UCITS ETF from Sprott and HANetf. The Sprott Junior Uranium Miners UCITS ETF (URNJ) will list on LSE, Xetra and Borsa Italiana in February 2024 and track the Nasdaq Sprott Junior Uranium Miners™ Index. The US-listed version of the ETF has gathered $344 million in AuM since its launch in February 2023. Sprott Junior Uranium Miners UCITS ETF is set to be the fourth ETF that HANetf and Sprott Asset Management have launched together, following Sprott Uranium Miners UCITS ETF (ticker: URNM), Sprott Energy Transition Materials UCITS ETF (ticker: SETM) and Sprott Copper Miners ESG Screened UCITS ETF (CPPR).
URNJ is designed to offer investors pure-play exposure to junior uranium mining stocks set to benefit from the global growth of nuclear power. In contrast to URNM, URNJ focuses on small and mid-size uranium miners that may have the potential to outperform in the near future. The US-listed version of URNJ has had strong success in the US, gathering $327 million in AuM.
The US version of this fund has extensive Canadian exposure at 46% of the fund, along with Australian stocks at 29%, which consists of 32 stocks. The top five holdings in the US fund include NexGen Energy (12.6% of the fund), Paladin (at 12.29%), Uranium Energy (at 11.59%), Denison Mines (at 10.88%) and EnCore Mines (at 4.75%). The TER of the US version of the fund is 0.80%, which is cheaper than the Geiger Counter, which has an annual fee of around 1.35%.
Japanese Funds and the importance of hedging your equity exposure
You might just have heard by now that Japanese equities are on a tear again, many decades after their last surge. The main benchmark index, the Nikkei, is now approaching the all-important 40,000 barrier and in recent days has blown past its level from 40 years ago. The alternative, broader Topix index has also smashed past its 52-week high at 2565.
You might at this point think that Japanese equities overall should be expensive – wrong. Looking at the Topix index the current price-to-earnings ratio is running at around 16 – compared to over 20 in the US – and the price-to-book ratio is at 1.39 (for a range, the same ratio bottomed out at 0.91 in 2011 and hit a maximum of 3.54 at the end of 1999).
But it would be a mistake to think that all Japanese stocks are at fair or even average valuations. Many tech-oriented Japanese stocks trade at valuations over Magnificent metrics! The e-commerce retailer Fast Retailing trades at 46.6 times earnings, while the robotics play Fanuc is at 30.5 times earnings. Even Softbank trades at 25.9 times earnings. Looking at the Japanese markets in aggregate also misses out on the different types of equities. Dividends (and buybacks) have been surging in Japan, pushing more money back to shareholders, as this chart from Samarang shows.
And there’s also a crucial difference in returns for different cap sizes i.e many smaller cap equity funds have been significantly underperforming the broader benchmark indices. The table below shows the returns for several UK-listed Japanese equity funds and their respective indices. I’ve marked in red those funds that have failed to keep up with their benchmarks. One aside – Japanese small caps since May 1998 have produced a compound return of 6.73% annualised whereas the Topix has produced an equivalent return of 4.82% annualised.

I have no idea whether Japanese stocks will continue to appreciate but I would make one comment – if you do want to invest in Japanese equities, I would strongly recommend hedging out your currency risk. It’s precisely because many London-listed Japanese investment trusts don’t hedge their yen exposure which helps explain why their performance has fallen behind the local currency-based benchmark. The good news is that there are a range of currency-hedged Japanese equities ETF trackers that do hedge their yen exposure – that strategy of hedging the currency might cost more in fund fees, but the extra cost is absolutely worth it in my view.

More bad news for D9
Just when you thought it was safe….
Poor old Digital 9 has suffered yet another blow. According to Liberum:
“Iceland’s anti-trust authority has opened a Phase II investigation into the proposed sale of Digital 9 Infrastructure’s Verne Global Business to Ardian France. The period for the Phase II investigation is up to 90 days, extendable to 135 working days. While the Icelandic anti-trust authority is not obliged to use the full period, the potential sale is at risk of not receiving approval within the Q1 2024 timeframe DGI9 had guided to.”
The shares have now cratered below 20p and the company is now valued at just over £150m at just over 17p a share. The discount is also now enormous at over 75%, which factors in a great many downside possibilities – not least that the volcano currently spewing lava might head towards the airport where D9’s main facility is based (it’s a long way from the lava flows by the way).
Analysts at Liberum note that Phase II investigations are fairly common undertakings by Iceland’s anti-trust authority. In 2022, Iceland’s Competition Authority received 30 merger notifications, out of which 10 went to Phase II investigations. All 10 were cleared with conditions. In truth, I would expect an investigation bearing in mind that the data centre is one of the country’s main power users.
The long list of calumnies inflicted on suffering D9 investors – me included – defies belief. My guess is that next up, we’ll have a revaluation of the remainder of the portfolio with a haircut on the Arqiva shareholding and possibly also the fibre business Aqua Comms. I stick by my analysis that even on the very worst case analysis, a base case valuation puts the shares’ breakup value at 40p, a more likely 70p, and even a possible upside valuation of 90p.
David Stevenson
Got some thoughts on this week’s article from David? Share these in the SharePad chat. Login to SharePad – click on the chat icon in the top right – select or search for ‘share chat’.

This article is for educational purposes only. It is not a recommendation to buy or sell shares or other investments. Do your own research before buying or selling any investment or seek professional financial advice.


