
In this month’s focus on funds, we take a quick look at asset class returns in 2023 courtesy of some wonderful heatmaps, we eavesdrop on a recent bank event at the state of UK PLC, and we examine an under-owned asset class that could be the verge of big things – local currency emerging markets debt.
2023 in Pictures
Like many, I thought that in 2023, the US would lunge into recession, taking corporate earnings growth with them, and that China would rebound from zero COVID with dragon-like ferocity. As we all know now, the exact opposite happened in both cases. Corporate earnings increased, largely because US consumers carried on spending. That meant the S&P 500 enjoyed another positive year. The chart below is from Peter Berezin of BCA Research using Bloomberg data (via the excellent John Authers) and shows the way in which strategists got it so wrong in 2023. They (we) all expected the S&P 500 to flunk into a funk but instead year to date the S&P 500 as I write is up 20%. Ouch!
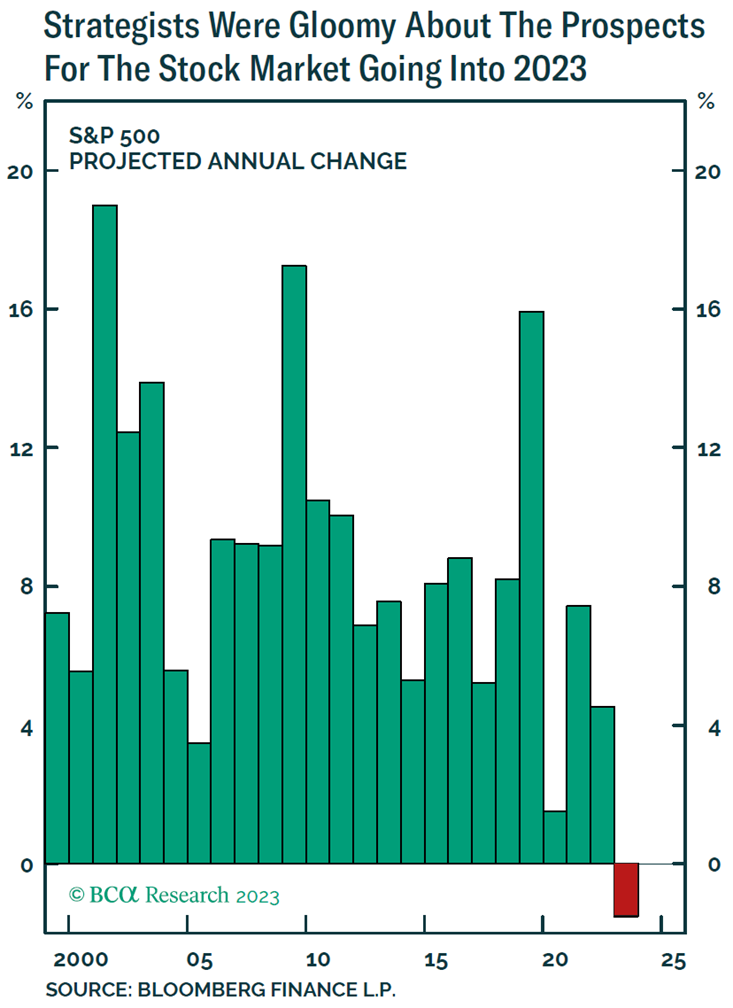
Given this lamentable failure to predict the most widely followed equity index on planet Earth, I think we can safely say that most forecasts for 2024 should be taken with a small tipper truck of road salt.
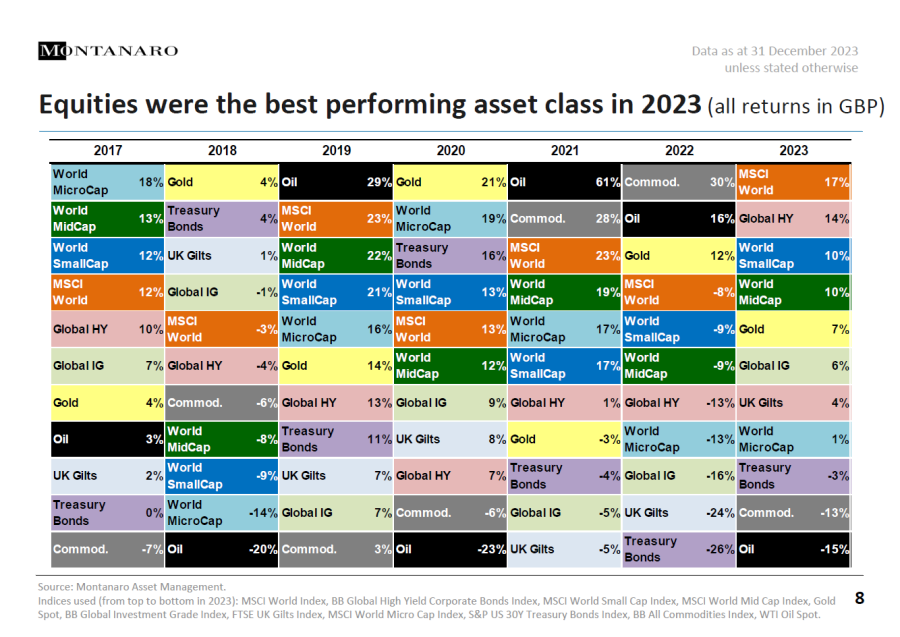
What’s far more interesting in my view is to look back at asset classes over a longer-term perspective and see what’s worked – and what hasn’t. One of the most interesting ways of doing that is through something called an investment heat map. These involve pulling together the main asset classes, assigning a colour, ranking them by year returns and then building a heat map. The beauty of this approach is that one can begin to understand the persistency of performance or even out performance over ten or more years. The first chart below – from fund manager Montanaro by way of Trustnet – looks at the last six years’ returns in pounds sterling. Several observations jump out:
- Gold has been surprisingly effective with a top-three performance in three of the last six years
- The MSCI World, with its US large-cap bias, has also been consistently outperforming in the top three for three years and never outside the top 5
- Oil is incredibly volatile
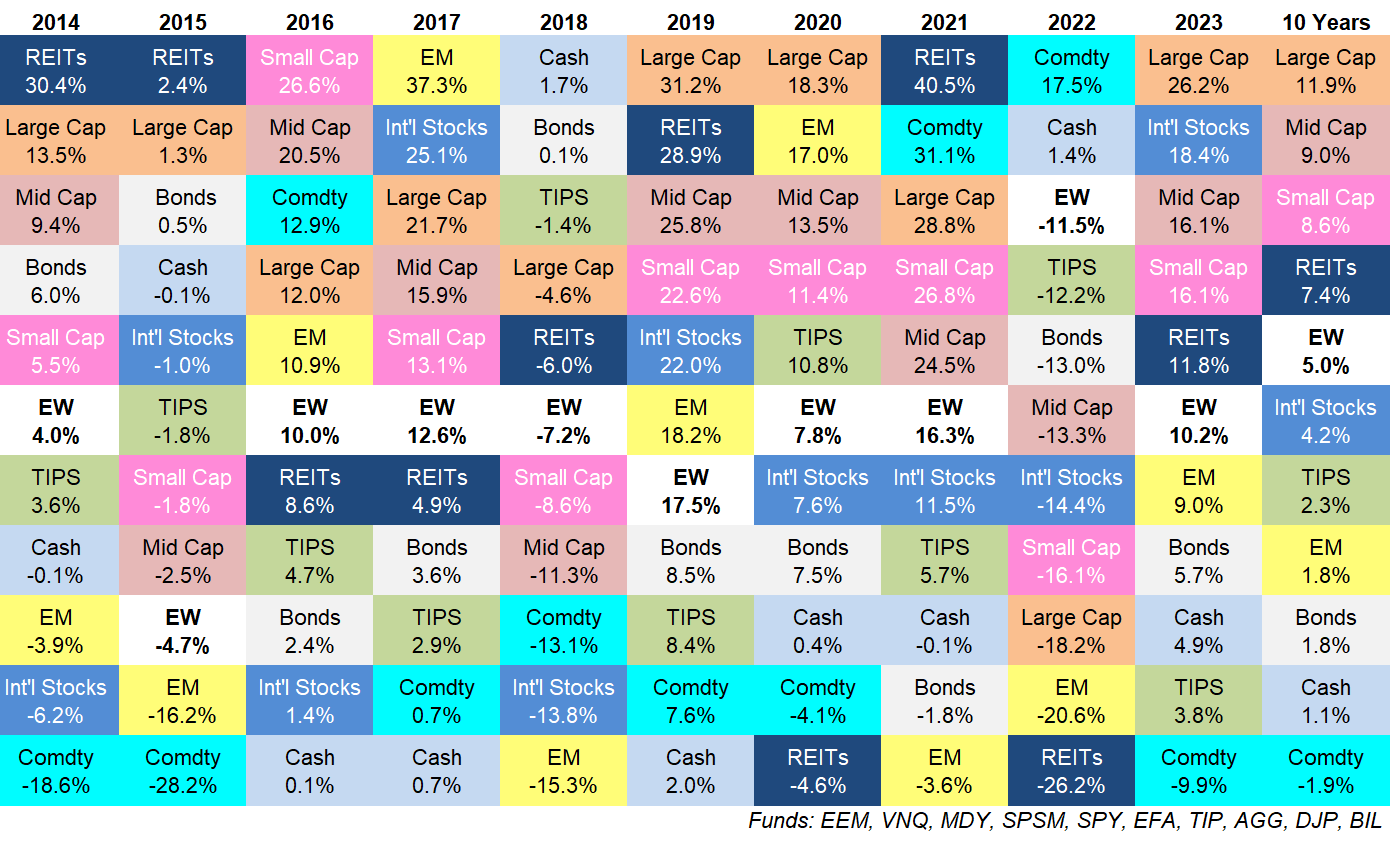
The next heat map comes from the US via advisory firm Ritholz Wealth and their excellent Ben Carlson. Here we have a US-centric view of the last ten years back to 2014. One trend stands out above all – the absolute dominance of US Large-cap equities, with US mid-cap equities not too far behind. By contrast, commodities as an asset class have been terrible – they’ve been in the bottom two classes in 6 out of 10 years.
One final point on what happened in 2023. Over the last couple of years everyone and their aunt has been indulging in Cathie Wood bashing, the founder and boss of tech fund management firm Ark has been a lightning rod for cynical investors who have cheered the demise of so many meme and theme-related ideas. One can understand why she is a bit marmite. She is opinionated, very marketing-focused, a business TV regular, and an eternal optimist. But she has real talent when it comes to making active bets. Her style doesn’t work in some markets but in others, she shines; so it shouldn’t come as a great surprise that one of Cathie Wood’s ETFs has had a standout 2023. Here’s a review of her funds by US Investment Weekly Barrons from the end of last year.
“Cathie Wood’s ARK Innovation ETF has pulled ahead of a Fidelity rival in this year’s race for top-performing exchange-traded fund. A key difference: Wood bet big on Coinbase Global while Fidelity shied away. ARK Innovation, Wood’s flagship ETF with $8.7 billion in assets, is up 66% this year, ranking first among diversified ETFs, according to data from Morningstar Direct and Investors Business Daily. Fidelity Blue Chip Growth ETF, up 55%, is in second place.
The funds were neck and neck a few weeks ago, but Wood is now winning the horse race, in good measure thanks to Coinbase. Shares of the crypto exchange have surged more than 300% this year; the stock accounts for more than 10% of Ark Innovation. “It’s no secret that we are bullish on the outlook for digital assets, Bitcoin in particular,” Tom Staudt, ARK Invest’s president and CEO, told Barron’s in a recent interview. “Coinbase stands to be a beneficiary.”
On a side note, I’d observe that Ark has recently taken over the small ETF issuer Rize – I would expect a UK launch of her US ETFs at some point in 2024.
Asset Class Idea: Global EM Debt, the local currency version
Many investors get terribly excited by the idea of investing in emerging markets. You’ve all heard the pitch by now: invest in those countries where populations are expanding as are consumer markets but corporates remain lowly valued. I won’t labour all the potential pitfalls but I will labour one particular question – for most investors investing in emerging markets means investing in EM equities. But if we look at many large institutions and how they invest in EM we see something very different – many invest in something called EM debt. The contrasts here are obvious: there’s less (though still high) volatility and you receive an income. Market data also suggests that you can benefit from diversification against mainstream equities, plus there’s an additional currency play at work.
I’d also mention one other key draw: China or the lack of it. Invest in most global emerging markets equity funds (ETFs and actively managed funds) and you’ll see a heavy focus on China, and to a lesser extent Hong Kong and Taiwan. A case can also be made for saying that South Korea has a close trading relationship with China and is thus almost umbilically tied to China and its prospects. This idea of Greater China trading block – the mainland plus its close trading partners – dominates equity indices to the tune of anything between 40 and 70% depending on the index and the measure.
Debt markets by contrast are very much more diversified. Take the iShares J.P. Morgan EM Local Govt Bond ETF as an example – we’ll come back to it but it’s the biggest passive fund in this space. This invests in EM government debt – local currency debt – and has only 10% exposure to China directly with the largest three holdings (excluding China) consisting of Malaysia (10%), Indonesia (10%), and Mexico (10%) followed by Brazil and Thailand. The point here is that you are getting exposure to fast-growing economies but via their government debt, and you are avoiding heavy China exposure.
The ETF I mentioned has another wrinkle – it’s invested in government debt denominated in the local currency. This introduces two important distinctions. The first is government versus corporate debt. Most investors can probably fathom why one is preferred to the other – most sovereign states do their damndest to avoid a default, whereas corporate defaults are much more common. Some states like Argentina do default but it is rare.
The next distinction is between dollar-denominated debt, which is usually regarded as lower risk, and debt denominated in the local currency which of course will be more volatile. For most investors, the idea of dollar-denominated government debt is the safest idea, but yields are obviously lower. Why invest in local currencies if you think that they are more volatile? Two reasons jump to mind. The first is that you often receive a yield boost. In addition, you might also be worried that the dollar might fall in value. The converse of this is that you might believe local currencies are cheap relative to the dollar and might thus appreciate.
Which brings us to the idea of investing in local currency debt, preferably of a government nature. This has been something of a neglected asset class but it might make more sense if you think, like many, that the current USD overvaluation is at relatively extreme levels. If the dollar does weaken – think election mayhem – then local currency EM debt might benefit from a strong ongoing tailwind for non-dollar assets in general.
A recent paper by the US fund GMO – which has long championed EM debt – makes what I think is a useful case for saying that now is the time to invest in local currency EM debt. Their core conclusion: the current situation is “arguably the best set of conditions we have seen in twenty years, based on valuations, diversification considerations, and alpha potential.” Of course, they’d say that (they are trying to sell their funds) but there are good reasons for believing this well-respected manager on this particular subject.
One of their core arguments is that the US dollar is, by most conventional measures, over-valued. There’s also a weight of evidence to suggest that the dollar moves in roughly decade-long swings relative to global currencies: according to GMO “When the dollar is cheap, as it was around 2011, its rise drained returns to foreign stocks and bonds. But, when it’s rich, as it is now, its decline portends a boost” to non-dollar assets.
The rates environment also makes a big difference: current interest rates are essentially back to the 2004-2011 average when EM debt did very well, “offering high total return potential above spot FX appreciation. It’s extremely rare to get this combination of cheap currencies with high rates – and it doesn’t generally last long.”
One of the drivers behind possible local currency appreciation is the growth differential at the level of national economies – many EM countries are growing faster than their developed world peers (which was true in 2003 to 2011 when EM debt outperformed) although that differential is likely to be less pronounced this time around largely because of China’s current travails. Crucially though EM interest rates are much higher than developed world rates which might help underpin local EM debt.
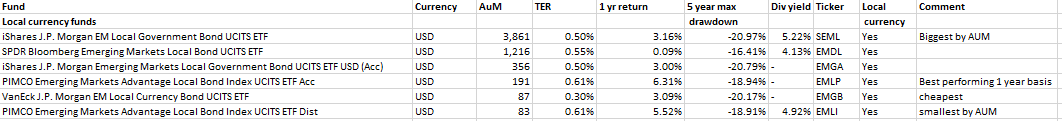
So, how to invest? The good news is that over the last few years, there’s been a bunch of new ETFs issued in this market catering to more institutional demand. In the table below I’ve listed the most relevant local currency EM Debt funds, with iShares very much dominating the market in terms of AuMs.
If you’re after the biggest, most liquid fund I would look at iShares J.P. Morgan EM Local Government Bond UCITS ETF which has over $3.8 bn in assets. By contrast, if you’re looking for the cheapest fund I would opt for VanEck’s J.P. Morgan EM Local Currency Bond UCITS ETF which has a low TER of just 0.30%. Last but by no means least my own personal favourite fund would be PIMCO Emerging Markets Advantage Local Bond Index UCITS ETF Acc, which is actively managed by the bonds giant Pimco who have a long track record of managing money in this space. The fund references a benchmark but the managers can also switch exposures based on their on proprietary data.
UK PLC In review
At the tail end of last year, one of the major investment banks in the UK held a top-level conference for nonexecutive directors of companies and funds. In particular, there was a section of the event on takeover activity for UK-listed targets from the perspective of one PE player. A colleague went along and these are their very useful contextual notes:
- The factors leading to low absolute and relative UK share prices are well known but the outflows fund/wealth managers are facing are £600m to £1 billion a month, for 28 straight months now.
- Because companies are trading at such discounts, the takeover bids appear to be at generous premiums to the previous share price (160% for Mars’ bid for Hotel Chocolat) but if you look closer the EV/EBITDA multiples are pretty low.
- Despite recent fluctuation in the USD/GBP exchange rate, sterling is never going to go back to $1.50-$2, so UK companies continue to look cheap in USD terms.
- There is plenty of dry powder for deals. PE funds find it difficult to raise money now, but those that raised in the last 2 years of interest rate/inflation volatility are itching to deploy now. While banks have reduced appetite to fund leveraged buyouts, unlike post-GFC, private credit funds have stepped in.
- The market cap of much of the FTSE 350 is doable by even mid-sized US PE firms who until now have been purely domestic. Their sweet spot is £50m to £3 billion.
- There is a 20% gap in expected earnings of US versus UK companies.
- UK companies are trading at big discounts to their US counterparts. For example, UK car distributor Lookers was at a 40% discount to its US counterparts, trading at 4X EBITDA, while Autotrader and Penske (who took it over) trade at 10 X EBITDA.
- There is a bit of a dance between the first offer of the PE firm and the target’s board, but with continued sluggish share prices target boards are getting more realistic.
- Management teams are frustrated with not being able to grow or raise equity, so are open to overtures from PE firms or even approaching them first.
- As an aside, another way of exiting the UK equities market is for firms exploring listing in NY. For companies already listed in London, it is too hard to move the sole listing because a 75% shareholder vote is needed to delist from LSE. The institutions won’t approve it because they would have to pay more in NY (10X instead of 4X) for the same shares. So it’s only firms that aren’t yet listed that are opting to list in NY rather than London.
Leveraged Shares and Tech
There’s a whole hidden world – to most investors – of short and leveraged (S&L) tracker products on the UK market. The basic formula is a long (bull) share and a short (bear) share tracking a major asset class or well-known share. The leverage on the upside or the downside varies from 1 times the daily return all the way to 5 times the daily return – with most products offering 3x the return.
The key is that these products set values and prices on a daily basis – so you get three times the return that day. That daily gearing of returns makes these products useful for some – very risk-friendly – traders. It also makes sitting tight on these products over many months a frequently disastrous strategy as all that compounding daily volatility will destroy the product’s value over many months. Notice though I said “frequently” – there are circumstances when markets are short to medium-term trends, usually bullish momentum trades, where that daily price volatility is ironed out and the trend is king.
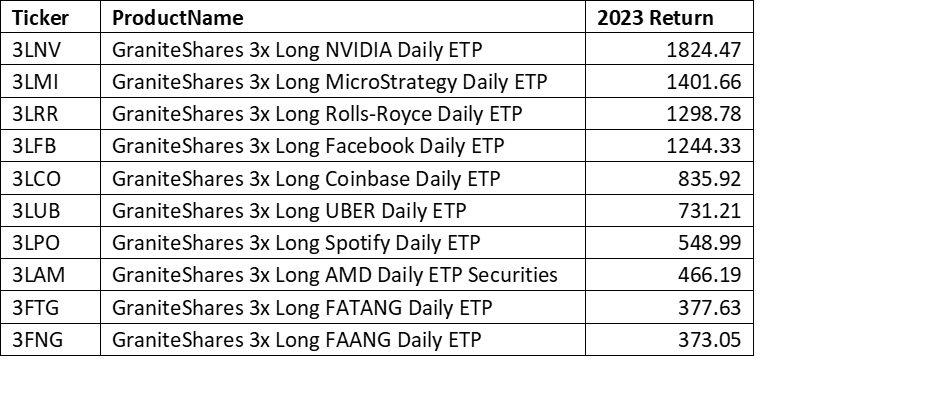
Unsurprisingly, that is the case with upside, bullish, long-tracker products covering tech stocks. In the table below, GraniteShares have mapped out their top-performing SA&L products for 2023. Their Nvidia 3 times daily returns product was up a staggering 1824% in 2023, with MicroStrategy (a bitcoin play) not far behind and Rolls Royce in at number 3 (with a 1298% return). Needless to say, a short, bear version of these same shares would have been utterly disastrous.
 David Stevenson
Got some thoughts on this week’s article from David? Share these in the SharePad chat. Login to SharePad – click on the chat icon in the top right – select or search for ‘share chat’.

This article is for educational purposes only. It is not a recommendation to buy or sell shares or other investments. Do your own research before buying or selling any investment or seek professional financial advice.


