
In the second of his articles about stock-picking formulas, Phil takes a look at the Piotroski F-Score to see how useful it is at identifying winning shares.

My previous article looked at the usefulness of The Magic Formula as an investing strategy in today’s stock markets. In this article, I am going to turn my attention to another stock ranking system in Piotroski’s F-Score to see if it has anything to offer investors.
What is The Piotroski F-Score?
The F-Score has its roots in value investing strategies and the process of identifying undervalued shares.
Back in 2002, Chicago University accounting professor Joseph Piotroski took a closer look at the strategy of buying shares with a low price to book value or net asset value (P/BV or P/NAV).
What he found out was that the investment results were not as good as they could have been. His studies confirmed what a lot of investors have found out for themselves over the years. Blindly buying shares just because they are cheaply valued is not a guaranteed route to investing success.
Lowly valued shares can be traps for the unwary. The low valuation often tells the investor that there are some difficulties being experienced by the company behind the shares. Instead of being tempted to load up on the shares, the better course of action in many cases is to stay well clear.
Piotroski found that lots of companies with low price-to-book values were financially distressed and continued to see a deterioration in their finances.
He concluded that the shares of companies with weak finances detracted from the performance of those in better financial health and reduced the investment returns of a low-price-to-book value portfolio.
So Piotroski set about finding out whether he could filter out the bad companies by setting some important tests of their finances and business performance.
He used the information found in a company’s financial statements to devise nine tests of financial strength. If the company passed the test it was awarded one point. If it failed then it scored zero.
The results from all nine tests were added together to give what is known as an F-Score. High F-Scores (7-9) are seen as a sign of improving financial condition.
Piotroski looked at shares between 1976 and 1996 and found that if he combined shares with low price-to-book values and high F scores (improving finances) the annual average returns of an investor could be enhanced by 7.5 per cent per year compared with just using valuations alone.
A strategy of buying expected winners (high F scores) and selling expected losers (low F scores) over the same time period generated average annual returns of 23%.
Piotroski also found that his strategy worked best with small and medium-sized companies, with low trading volumes and with few or no stock market analysts following them.
He argued that for these types of companies, the stock market took a long time to fully reflect historical financial information in their share prices. This was not the case for bigger companies which are more closely followed by professional investors.
One of the key attractions of the F-Score is that it is based on facts that are freely and readily available to any investor.
However, It is also backwards-looking and not based on estimates or opinions as to what might happen to a company in the future which is rightly seen as being very important.
The nine tests that make up the F-Score
Piotroski focuses on three key areas of a company’s financial performance:
- Profitability
- Financial Leverage and Liquidity
- Operating Efficiency
Profitability
Piotroski devised four tests of a company’s profitability. Each test passed scores one point towards the F Score:
- A positive return on assets (net income/total assets).
- An improving return on assets compared with the previous year. This indicates that the business is improving.
- Positive cash flow from operations.
- Cash flow from operations is greater than net income. It is harder to fudge cash flow than profits. Improving cash flow is a good sign.
Financial Leverage and Liquidity
In addition, Piotroski focused on the ability of a company to meet its financial obligations. He argued that If debt increases, liquidity declines or money from external sources (shareholders or lenders) is needed this is seen as a bad sign and the shares of such companies should be avoided.
One point is awarded for passing the following three tests:
- Change in leverage. This is measured by looking at the change in the ratio of long-term debt to average total assets. A reduction in leverage is a good sign. Increases in borrowings may show an inability to generate funds internally from profits.
- Change in liquidity. Here, we are looking at the ability of a company to turn assets such as stock and debtors into cash to pay some of its bills. This is measured by changes in the current ratio (current assets divided by current liabilities) during the last year. A higher current ratio is seen as desirable.
- Any issues of fresh equity. This can be a bad sign as it shows that a company cannot generate sufficient funds from its own cash flow. Issuing equity when a share price is depressed is also a warning sign.
Operating Efficiency
Finally, Piotroski looked at a company’s operating efficiency and screened for improvements in the following two ratios:
- Change in gross margin (gross profits/turnover). Higher profits are better than lower ones.
- Change in asset turnover (Sales/Total Assets). An improvement here shows that a company is getting more out of its asset base and becoming more financially productive.
The F-Score in SharePad
SharePad calculates the F-Score for a company so that you don’t have to. Here it shows how Next PLC has achieved a perfect nine score.
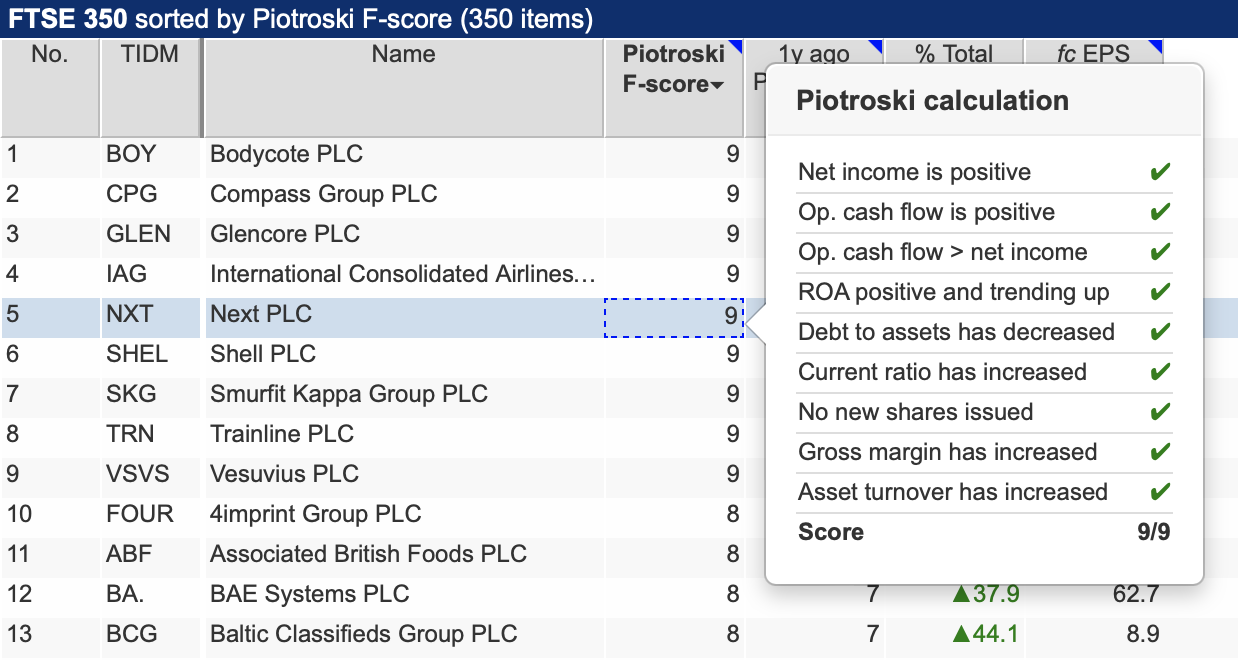
Source: SharePad
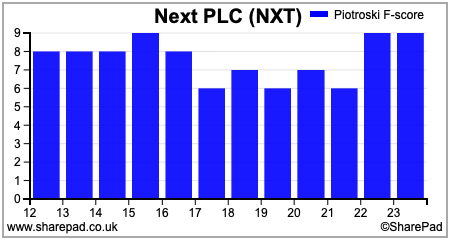
You can also see how a company’s F-Score has trended over time and show it in a SharePad financial chart.
Should you wish to then use the F-Score to look for shares which are both lowly valued and have an improving financial performance then SharePad can quickly do this for you as well.
The F-Score and UK shares over the last year
Piotroski used his F-Score to try and find attractive shares with a low price to book value.
Price to book value as a measure of stock valuation has arguably become less useful as economies and stock markets have moved away from asset-intensive industries to more asset-light and service-based industries.
Instead of using P/NAV as a valuation, I have used a price-to-earnings (PE) ratio instead. SharePad has then found me a list of shares based on a Piotroski F-Score of eight or nine one year ago and with PE a year ago of 10 or below.
Getting SharePad to do this is easy when adding a screening criteria to a filter as shown below.
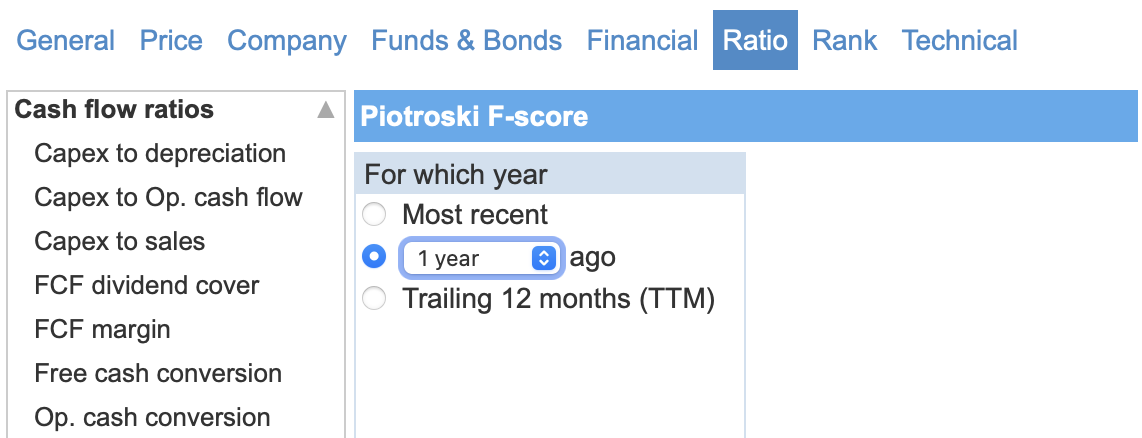
Source: SharePad
This filter found 50 qualifying shares listed on the London market. Of these, 21 delivered positive total returns with 18 performing better than the 6.1 per cent delivered by the FTSE All-Share Index over the last year..
The majority of the shares lost money. The filter could have suggested that you buy companies such as Superdry (LSE:SDRY) which had an F-Score of eight a year ago and then lost 66.6 per cent of its value in the following twelve months.
Superdry now has an F-Score of three which is telling investors to stay well clear. This is clearly of no comfort to anyone who saw the previous score as a green light to buy the shares.
This highlights a key weakness of the F-Score in that it reflects the downturn in financial performance that has happened over the last year but did nothing to highlight the risks beforehand.
Interestingly, if the valuation criteria had been ignored and shares just selected on the basis of F-Scores alone, the number of winning shares actually increased.
Of the 172 shares with scores of eight or nine, 91 delivered positive returns and 74 outperformed the FTSE-All Share.
However, the approach also delivered some horrific performances such as Safestyle UK (LSE:SFE) where shareholders have subsequently been all but wiped out.
In terms of the number of winning shares, picking those with the lowest F scores (0-3) worked best. This approach delivered 113 winners of which 95 outperformed the FTSE-All Share.
That said, it seems that this approach involved a significant amount of risk. 130 shares lost at least half their value whilst 32 shares lost more than 80 per cent of their value in the following year.
What is the F-Score highlighting right now?
SharePad has compiled a list of shares with F-Scores of eight or 9 and a trailing twelve-month (TTM) PE of 10 or below.
On this basis, it lists the following shares in different segments of the UK stock market.
FTSE 350
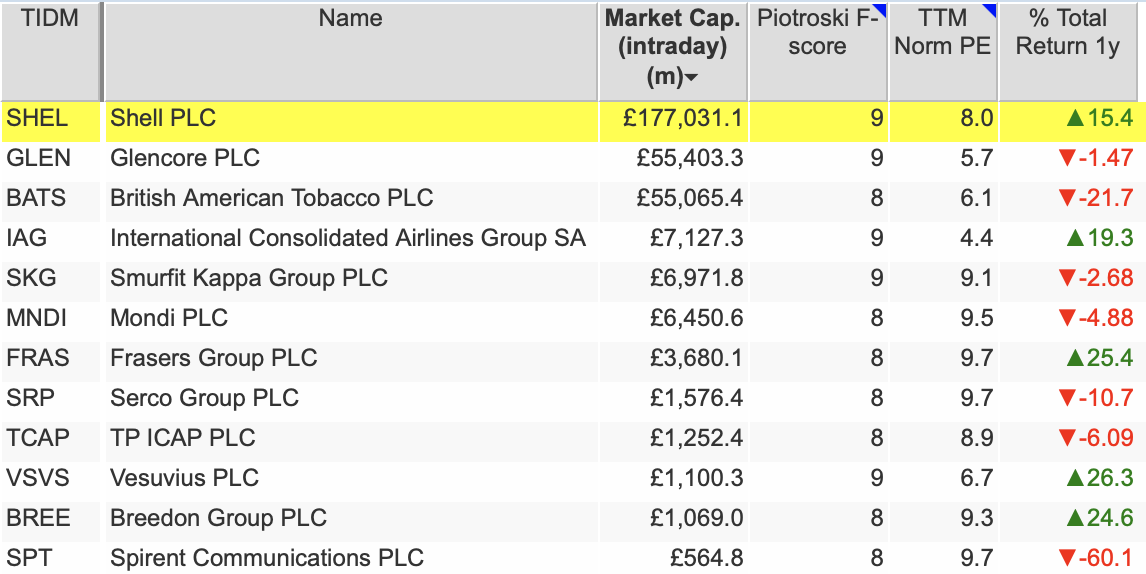
Source: SharePad
FTSE Small Cap
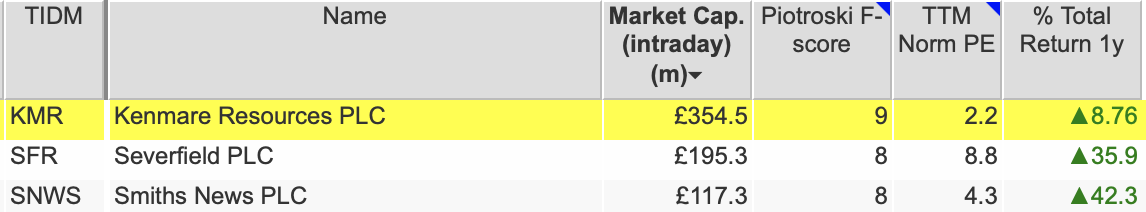
Source: SharePad
AIM
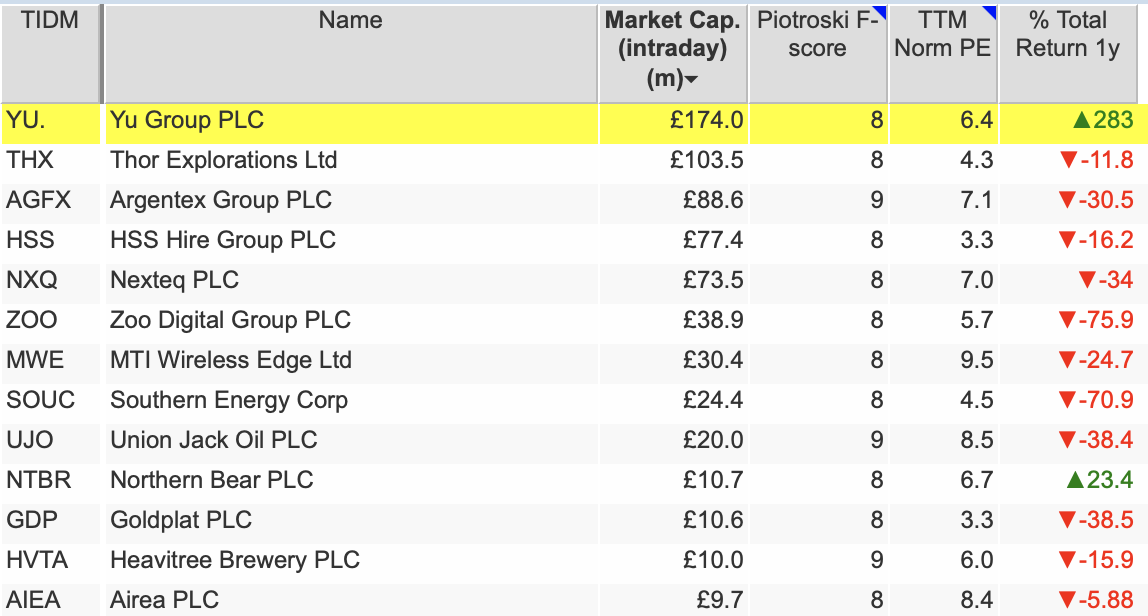
Source: SharePad
Using F-Scores but ignoring valuation
By getting rid of a valuation criteria and selecting shares with the maximum F-Score of 9 gives the following lists:
FTSE 350
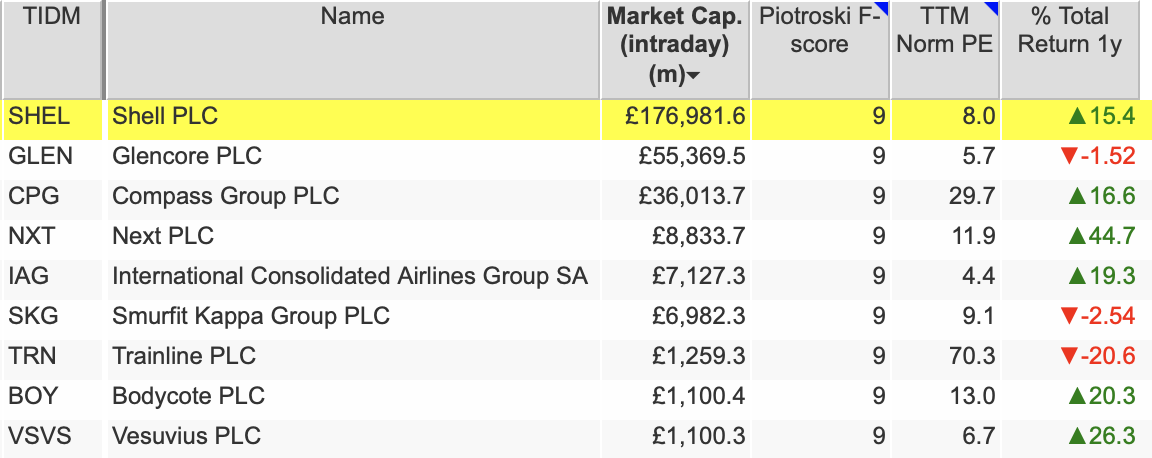
Source: SharePad
FTSE Small Cap
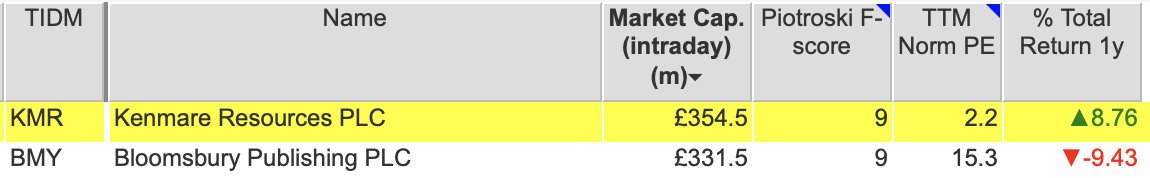
Source: SharePad
AIM
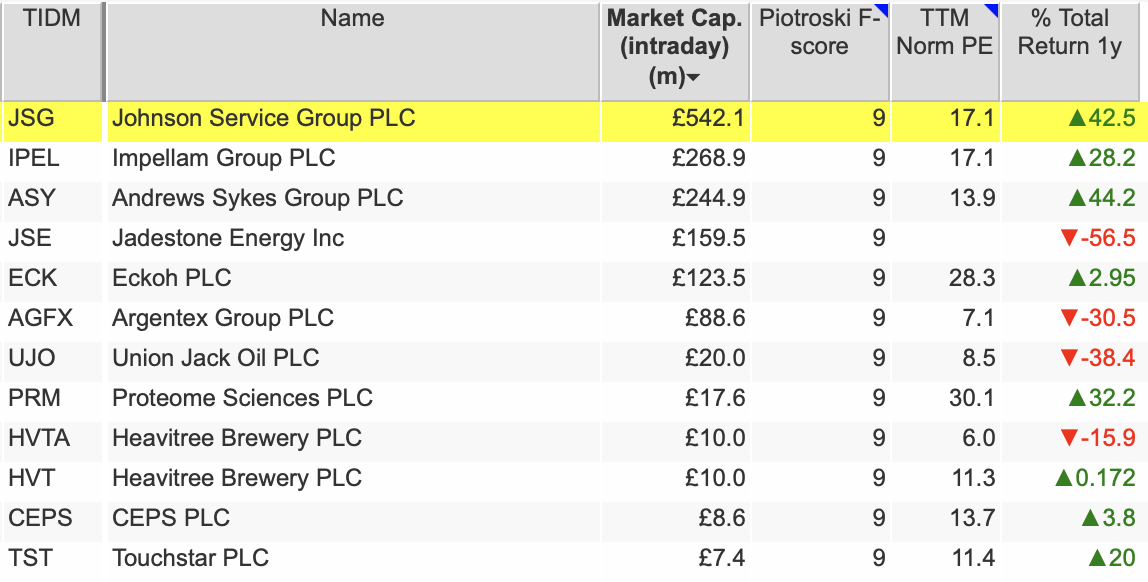
Source: SharePad
Should investors use the F-Score when weighing up a company?
I must admit, I have never used the F-Score when analysing a company and do not know anyone who does.
Looking at the number and changes in it is not going to do any harm, but as with any analysis, taking the time to get behind the numbers and what it going on with a business is going to be a better use of your time,
Whilst some of the reasoning behind the F-Score seems fair enough, it has many shortcomings.
Investors want to see improvement in financial ratios but some of the criteria in the F-Score does not stand up to closer scrutiny.
For example, an increase in the current ratio can be a sign of weakness rather than a sign of strength.
An increase in stock levels can be a sign of declining demand for a company’s products whereas an increase in trade payables or debtors can be a sign of overtrading. The F-Score would see both as a positive development.
A positive return on assets and an improving return on assets could still mean that you are looking at a weak company if those returns are low. Setting a minimum return on assets criteria seems to make more sense.
A company issuing fresh equity is not necessarily a bad thing either. If money is being raised to invest in profitable and high-returning businesses then shareholders should welcome this.
Probably the biggest drawback of the F-Score is that it fails to consider the all-important issue of growth which is what tends to make long-term shareholders better off more than anything else.
Finally, as with many strategies, the F-Score can produce horrible outcomes as well as good ones.
What should you do instead?
Having a scoring system is not a bad idea when it comes to picking shares for your portfolio. It can introduce some necessary discipline into your stock selection process which is a good thing providing you stick to it.
For any scoring or ranking system to be useful, it must be based on meaningful criteria that have a chance of leading to a profitable investment.
There are no hard and fast rules as to what these might be but taking into account factors such as the strengths and weaknesses of a business model, profitability, growth, financial strength and valuation are good building blocks.
As an example, my fellow SharePad writer and seasoned private investor, Richard Beddard, has built his own decision engine which he has been using for years. It is based on the following five quantitative and qualitative criteria:
- Profitability: Does the business make good money?
- Risks: What could stop it from growing profitably?
- Strategy: How does its strategy address the risks?
- Fairness: Will we all benefit?
- Price: Is the share price low relative to profit?
The first four criteria are scored from 0 to 2. The fifth is scored from -2 to 1.
There is an emphasis on cheaper-looking shares which can get a boost of up to 1 point, but expensive-looking shares are penalised by up to 2 points. The maximum score for any share is 9. The higher the score, the more attractive a company and its shares are deemed to be.
~
Got some thoughts on this week’s article from Phil? Share these in the SharePad chat. Login to SharePad – click on the chat icon in the top right – select or search for a specific share.

This article is for educational purposes only. It is not a recommendation to buy or sell shares or other investments. Do your own research before buying or selling any investment or seek professional financial advice.


