
The Capex to operating cash flow ratio can tell us a lot about a firm’s priorities. Richard explores the ratios of a number of capital-intensive businesses.
For many years I have held shares in Goodwin, a family owned mini-conglomerate of engineering businesses. This gaggle of businesses is capital intensive, which means Goodwin has to invest lots of money in factories, heavy plants, and equipment to grow them.
One-half of the business casts steel in a giant foundry and machines it into products for the nuclear, defence and oil industries primarily. The other half processes minerals consumed in the casting of jewellery and tyres and a wide range of other applications including, for example, extinguishing lithium-ion battery fires.
It has spent much of the last decade enlarging its foundry so that it can meet the requirements of its nuclear and defence customers, inventing new products like its AVD fire extinguishing agent, and it has launched a startup, Duvelco, which will manufacture a polymer (high-end plastic) that can withstand very high temperatures.
It has other strings to its bow, but my objective today is not to give you a detailed appreciation of the company, it is to discover whether all that investment is as costly as it sounds.
Capex as a % of operating cash flow
One way to do that is to compare capital expenditure to operating cash flow.
Capital expenditure is mostly spending on long-lived assets like factories, machines and vehicles but it can also include the cost of developing products as long as they, like the long-lived assets, are expected to generate profits for years to come.
Operating cash flow is the cash generated by the business during the year. It includes the cash inflows due to sales and cash outflows due to costs like payments to staff and suppliers. Operating cash flow excludes cash flows generated by investment or financing decisions, like capital expenditure, acquiring other businesses, and taking out or repaying loans, and it also excludes the dividend, a cash outflow to shareholders.
In other words, operating cash flow tells us how much cash the business made, which it can use to invest (either in maintaining and growing its existing businesses or acquiring new ones), pay down debt, or pay to shareholders. The choice the company makes is known as “capital allocation” and it is very important that businesses get these decisions right.
Investment is a good option only if the company can earn a decent return from it and not take big financial risks by borrowing heavily to fund it.
Running the numbers in SharePad
Happily, SharePad can compare capital expenditure and operating cash flow for us. One of its gazillions of data points is “Capex to operating cash flow”, which gives us the percentage of annual cash flow spent on capital expenditure.
Because of the narrow width of this article, I have only included five years of data in the custom table below, but the table SharePad goes back to 1994:
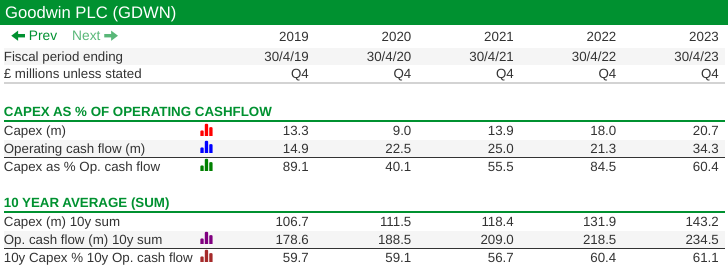
To understand the ratio, we will need to know what its components are. For example, in 2019 Goodwin spent 89.1% of its operating cash flow on capital expenditure, more than in any subsequent year, but this was not because capital expenditure was high, in fact, capital expenditure was lower than in three of the four subsequent years. It was because the operating cash flow was low.
At most capital-intensive businesses, operating cash flow and capital expenditure vary a lot from year to year.
Operating cash flow is impacted by the performance of the business, but it may also decline if the business is expanding rapidly, its factories are working at full capacity, and the company is funding lots of work in progress.
Likewise, capital expenditure is lumpy. If a company builds a new factory, it might last a generation but the cash cost will be deducted from cash flow in the year or two it is built.
The extreme variability of cash flows is one of the reasons we generally use profit to judge the performance of a business from year to year.
For Cash flow measures, long-term averages are particularly informative. While Goodwin’s capital expenditure has varied as a percentage of operating cash flow over the last five years between 40.1% and 89.1%, the ten-year average to the years up to and including 2023 is 61.1%*.
One way of showing you the data over a long period is by creating a custom financial chart in SharePad:
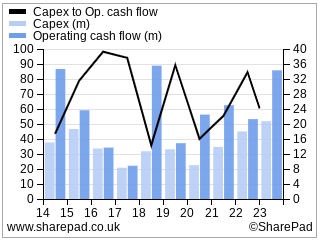
Since Goodwin is spending more than 60% of its operating cash flow on capital expenditure, it appears to be prioritising investment. But how does it compare to other capital-intensive companies?
Once you have set up the custom tables and charts in SharePad, we can get the big picture just by clicking on the space bar to examine lists of shares, either particular sectors or subsectors or, our own portfolios and watchlists.
Taking the analysis further
With a Capex to operating cash flow ratio of 60%, Goodwin is the third biggest spender on my watch list. Other honourable mentions include:
- Flavour manufacturer Treatt (89%). It has recently made a once-in-a-generation investment in a new manufacturing facility.
- Chocolate manufacturer and retailer Hotel Chocolat (82%). It has also invested heavily in building manufacturing capacity.
- Jet2, the leisure airline and package tour operator (58%). It buys a lot of planes.
- Churchill China, the manufacturer of tableware for the hospitality industry (41%). It invests heavily in automation.
- Polymer manufacturer Victrex (30%). It builds capacity ahead of anticipated demand.
A high percentage of capital expenditure to operating cash flow does not make a company a bad capital allocator any more than it makes it a good one.
If a company generates high returns from its investments, it grows profitably, in other words, it has invested wisely.
We cannot know this in advance, but I think the signs are good at Goodwin, it has record order books and earns a decent return on capital from past investments, which are largely in niche businesses that are difficult to compete with.
Loss-making Hotel Chocolat, though, has invested heavily in manufacturing and distribution, and it is palpably not making good returns on past investments. It has nixed its operations in Japan and the United States because it could no longer afford them.
The chocolate may be tasty, but the capital allocation probably has not been.
~
* SharePad calculates the ten-year averages by averaging the ratio for each individual year, but this can produce counter-intuitive results if there are outliers.
I prefer to sum up all ten years of capital expenditure, sum up all ten years of operating cash flow and calculate capital expenditure as a percentage of operating cash flow. This can also be done in SharePad lists and tables by combining the two items using “% of”.
By averaging the annual ratio, Treatt’s wildly gyrating numbers produce a 10-year average of -2.9%, mostly because in 2022 capital expenditure of £12.8 billion and -£1.8 million operating cash flow meant capital expenditure was -638% of operating cash flow, a meaningless number.
In fact, if you add up all the Capital expenditures and all the operating cash flows and calculate the percentage from the totals, Treatt invested 89% of operating cash flow over the last ten years, a tidy proportion.
~
Contact Richard Beddard by email: richard@beddard.net or on Twitter: @RichardBeddard
Got some thoughts on this week’s article from Richard? Share these in the SharePad chat. Login to SharePad – click on the chat icon in the top right – select or search for a specific share
This article is for educational purposes only. It is not a recommendation to buy or sell shares or other investments. Do your own research before buying or selling any investment or seek professional financial advice.


