
Investing has become more global. Gone are the days when UK private investors were restricted to putting their money solely in the UK stock market.
Today, many online brokers make it just as easy for a person to trade an individual share on European, US and Asian markets as it is on UK markets.

Of course, investors have been able to gain exposure to overseas shares easily by buying funds, investment trusts and exchange-traded funds(ETFs). However, we know that many ShareScope users want to invest in individual shares in their portfolios and we are here to help them with this.
All ShareScope subscribers get access to individual company data on US, Canadian and European shares as standard. There is nothing extra to pay for this.
Users can use the same analysis tools to research companies and shares in these markets as they do with UK shares.
This article will show you how to go about analysing US shares with ShareScope and how you might go about finding shares for your portfolio in US markets.
Why invest in US shares
As the world’s biggest economy with the world’s biggest stock market, the US is home to many of the world’s biggest and best companies.

Not only that, but the depth of the market offers investors more opportunities to buy good companies exposed to different sectors of the economy than if they just restricted their investing to the UK market.
US shares in general have handsomely trounced the returns from the UK market over the last decade and beyond. There are good reasons for this: US companies tend to be better, more profitable and grow their profits faster than UK companies.
Whilst past performance is no guarantee of future performance, most investors would expect these trends to continue going forward.
In fact, a UK investor buying an S&P 500 ETF- such as the iShares S&P 500 ETF – has actually fared better than a US investor buying the same fund over the last ten years.
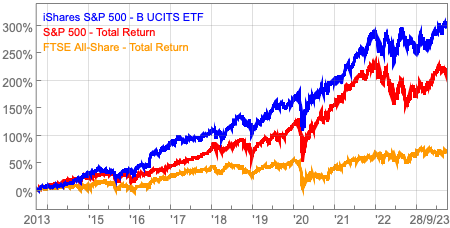
This is due to the depreciation in the value of the British Pound against the US dollar over that period which has resulted in US dollars being worth more in pounds.
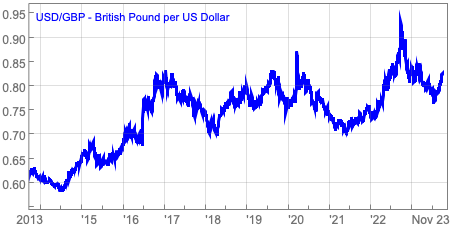
Ten years ago, a US dollar was worth around 62p. Today it is worth around 82p.
As we shall see shortly, exchange rates and exchange rate risk are major considerations for UK investors investing in overseas shares. Changes in exchange rates can add to or subtract from the performance of an investment in its local currency when it is converted back into British pounds.
The potential benefits of investing in US shares are not just about being able to invest directly in global giant companies such as Apple, Microsoft or Amazon but also impressive, smaller companies which would be big companies if they were listed on the UK market.
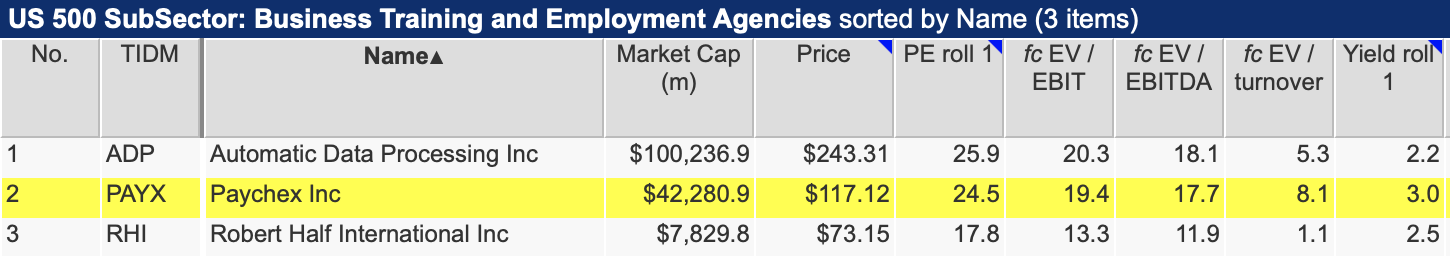
For example, Paychex (NASDAQ:PAYX) a provider of payroll and insurance services to small and medium-sized companies in the US, is a very profitable company that has returned 244 per cent to shareholders over the last decade.
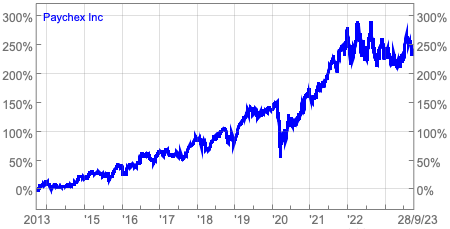
This compares very favourably with the 205 per cent total return of the S&P 500 but many UK investors will not have heard of Paychex.
At the time of writing, it has a market capitalisation of just over $42 billion (£35.5bn) which makes it the 179th most valuable company in the S&P 500 index. It would be the 15th biggest company in the FTSE 100 if it was listed in the UK and would be very well known.
Having the data and tools that ShareScope offers at your disposal means that you have a better chance of finding companies such as Paychex.
Some words on exchange rate risk
When it comes to investing in US shares, you need to be aware of the impact changes in the British pound to US dollar exchange rate can have on the value of US investments and the cost of buying, owning and selling them.
Exchange rate risk is sometimes not fully understood, especially by inexperienced investors.
In fact, most of us are exposed to exchange rate risks even if we own a portfolio of UK-listed shares. This is because there is a good chance that some of the shares we own will be in companies with large overseas businesses whose profits in pounds will change as exchange rates change.
Even if a company makes all its profits in the UK, it may need to buy raw materials or services from overseas in order to produce what they sell. The cost of these imported products will change as exchange rates change and can increase or reduce a company’s profits as a result.
Exchange rates and US shares

The first time you will notice the impact of exchange rates is when you first buy a US share. Unless you have lots of US dollars in your broking account you are going to have to exchange pounds for dollars when buying a US share.
Your broker will automatically do this for you by showing you an indicative exchange rate for the trade. This will usually be different from the current spot exchange rate in the financial markets which is used to value your investment after you have bought it.
The rate will usually be worse as far as your money is concerned.
To show you how this might affect you, here’s an example I took from a UK online broker in early September 2023 which is fairly typical of the customer experience.
Example: The impact of exchange rates when buying US shares
| Quote to buy shares in Apple =A | $182.36 |
| Broker Exchange rate = B | £1=$1.2435 |
| Actual Exchange rate=C | £1=$1.26 |
| Cost in £ to buy a share in Apple =A/B | £146.65 |
| Cost in £ at actual Exchange rate = A/C | £144.73 |
| Difference | £1.92 (1.3%) |
There is no stamp duty to pay as there is with many UK shares and dealing commissions are now very small, but the investor has lost 1.3 per cent on their investment immediately excluding any differences which exist between the buying and selling price – which in Apple’s case is usually very small.
A similar exchange rate effect will also take place when you sell the share.
Also, any dividends will be paid in US dollars and converting them back into pounds is likely to see the exchange rate work against you again.
Alternatively, you could allow your cash account to build up its stock of US dollars over time to help you buy US shares in the future without taking an exchange rate hit.
Another option, if you are investing through a Sipp or trading account, is to convert pounds into dollars before you trade to avoid currency conversion issues when buying or selling.
Bear in mind that Isas are not allowed to hold foreign currency so you will face exchange rate issues when buying and selling and collecting dividends.
The fluctuation in exchange rates can have a big impact on the value of any US shares that you hold. When the pound is rising in value against the US dollar, it means that less money is needed to buy a dollar – a pound buys more dollars or a dollar buys fewer pounds – and so the value of your US investment in pounds will fall.
Conversely, when the pound is falling in value against the dollar it requires more money to buy a dollar – a pound buys fewer dollars or a dollar buys more pounds – and the value of your US investment rises.
Impact of changing £/US$ exchange rate on Investment value
| Exchange Rate | £1=$1.50 | £1=$1.20 |
| US dollar value of investments | $100,000 | $100,000 |
| UK Pounds per USD | £0.666 | £0.833 |
| Pound value of US Investments | £66,666 | £83,333 |
This is why if you were very pessimistic on the value of the pound against the US dollar you might increase your exposure to US shares in order to try and boost your portfolio returns.
This worked well after the EU referendum in June 2016 when the pound plummeted on the global markets. For the following nine months, a UK investor in a sterling-priced S&P 500 ETF strongly outperformed the returns of the S&P 500 in US dollars.
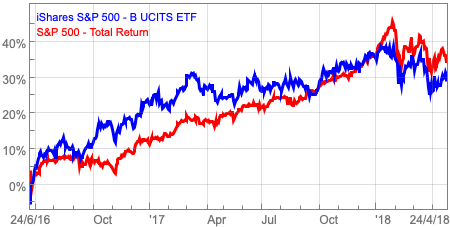
The sharp appreciation in the value of the pound over the last year since the calamitous UK mini-budget has seen UK investors in the S&P 500 sharply underperform the index in dollar terms.

Tax on dividends from US companies and capital gains tax
Overseas residents can pay 30 per cent tax on the dividends from US companies which can significantly reduce the amount of income they receive.
The UK has a double taxation agreement with the US which reduces the tax to 15 per cent. To benefit from this you will have to sign a W-8BEN form with your broker. Once this has been done, the dividend income will not be subject to any more tax.
If you are holding US shares outside of a tax-efficient account, you may have to pay more tax or receive a refund on your US dividend income depending on your personal circumstances. This can be calculated through the self-assessment process.
There is no capital gains tax to be paid on US shares held in an Isa or Sipp. Outside of these accounts, you may be liable for tax if you exceed the current tax-free allowance of £6,000 for the 2023/24 financial year. This allowance is due to fall further to £3,000 in 2024/25.
Investing in US Shares with ShareScope
ShareScope offers data on the following US markets:
- Nasdaq
- Nasdaq 100
- Dow Jones
- US 500 (S&P 500)
- NYSE
- Total US market
In total this amounts to 5725 shares compared with 2076 shares listed on the London stock exchange.
All the great tools that you can use with UK shares and the UK market you can apply to the US market as well.
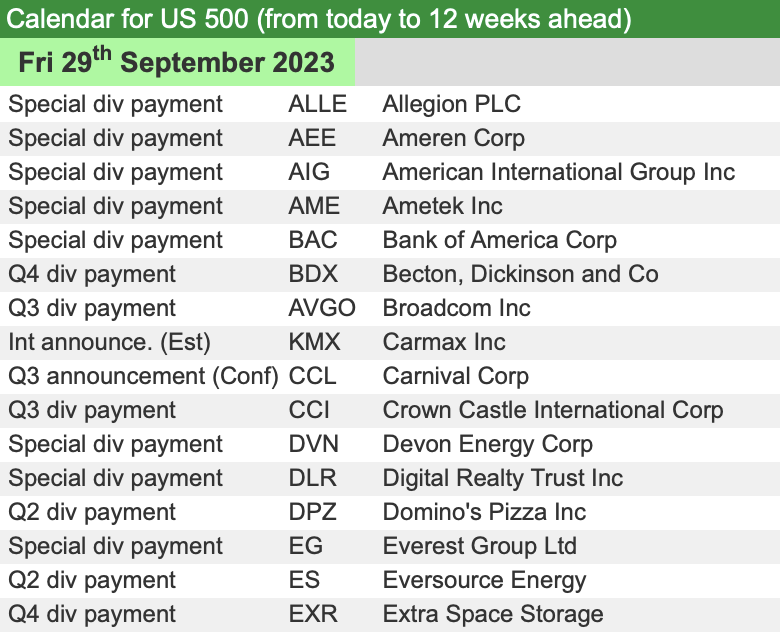
You have a calendar of future events such as dividend payments and company results which stretches twelve weeks ahead. This means you can be prepared for any significant events relating to your portfolio holdings.
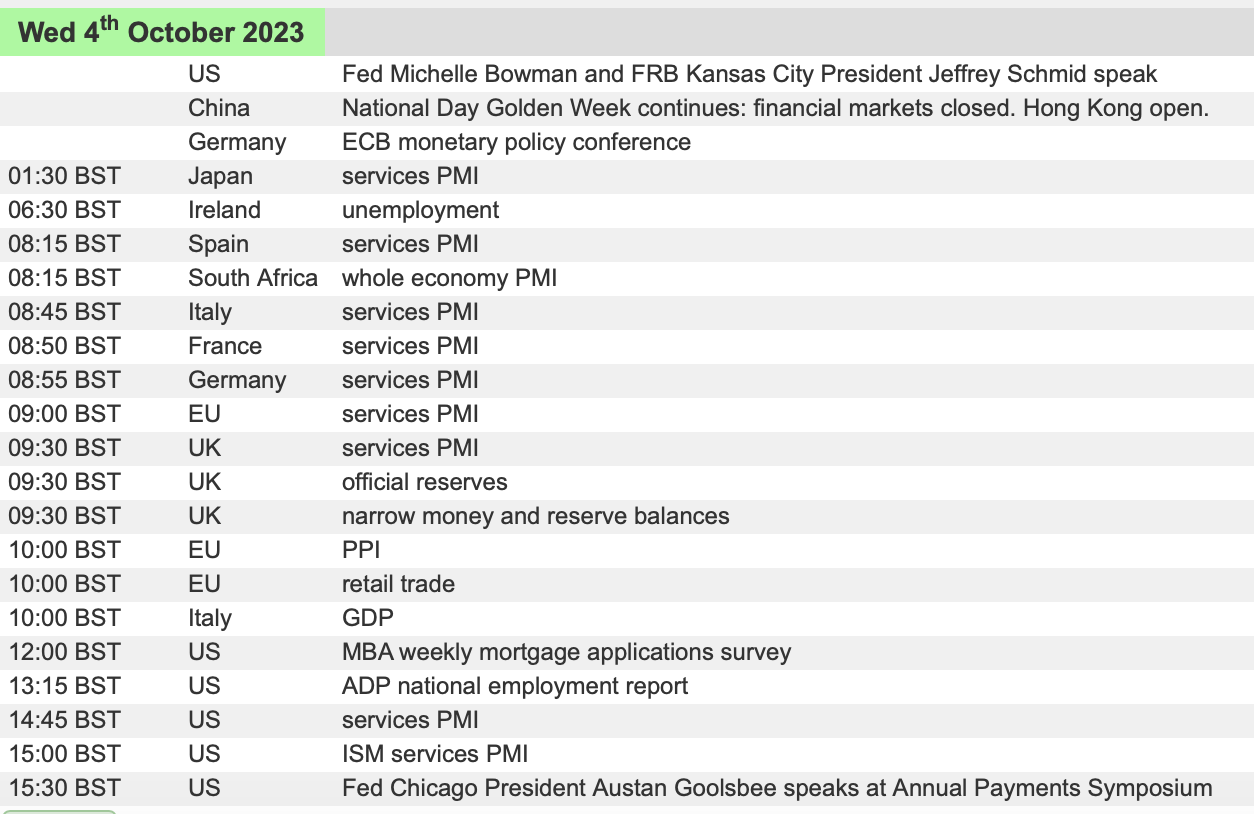
There is also an economic calendar. This is especially useful as stock markets around the world tend to react to what’s going on with the US economy. ShareScope offers a calendar on global economic events which is even better.
Analysing individual US shares with ShareScope
US shares have the same comprehensive data as UK shares. ShareScope has financial and pricing data going back decades as well as some of the best forecast data available to UK private investors. This is backed up with excellent news coverage to help you keep up to date with a company’s progress.
Using Paychex as an example, you can see the kind of analysis that can be quickly done with ShareScope.
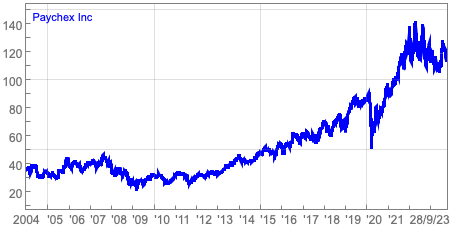
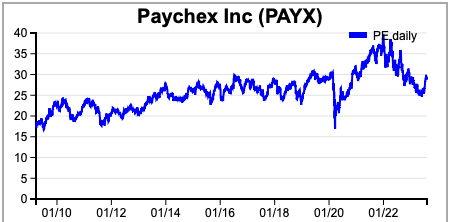
For this company, there is nearly 20 years of price data. Putting it in a chart can allow you to spot significant changes quickly to help you identify and investigate a past event as well as showing current market sentiment towards the shares.
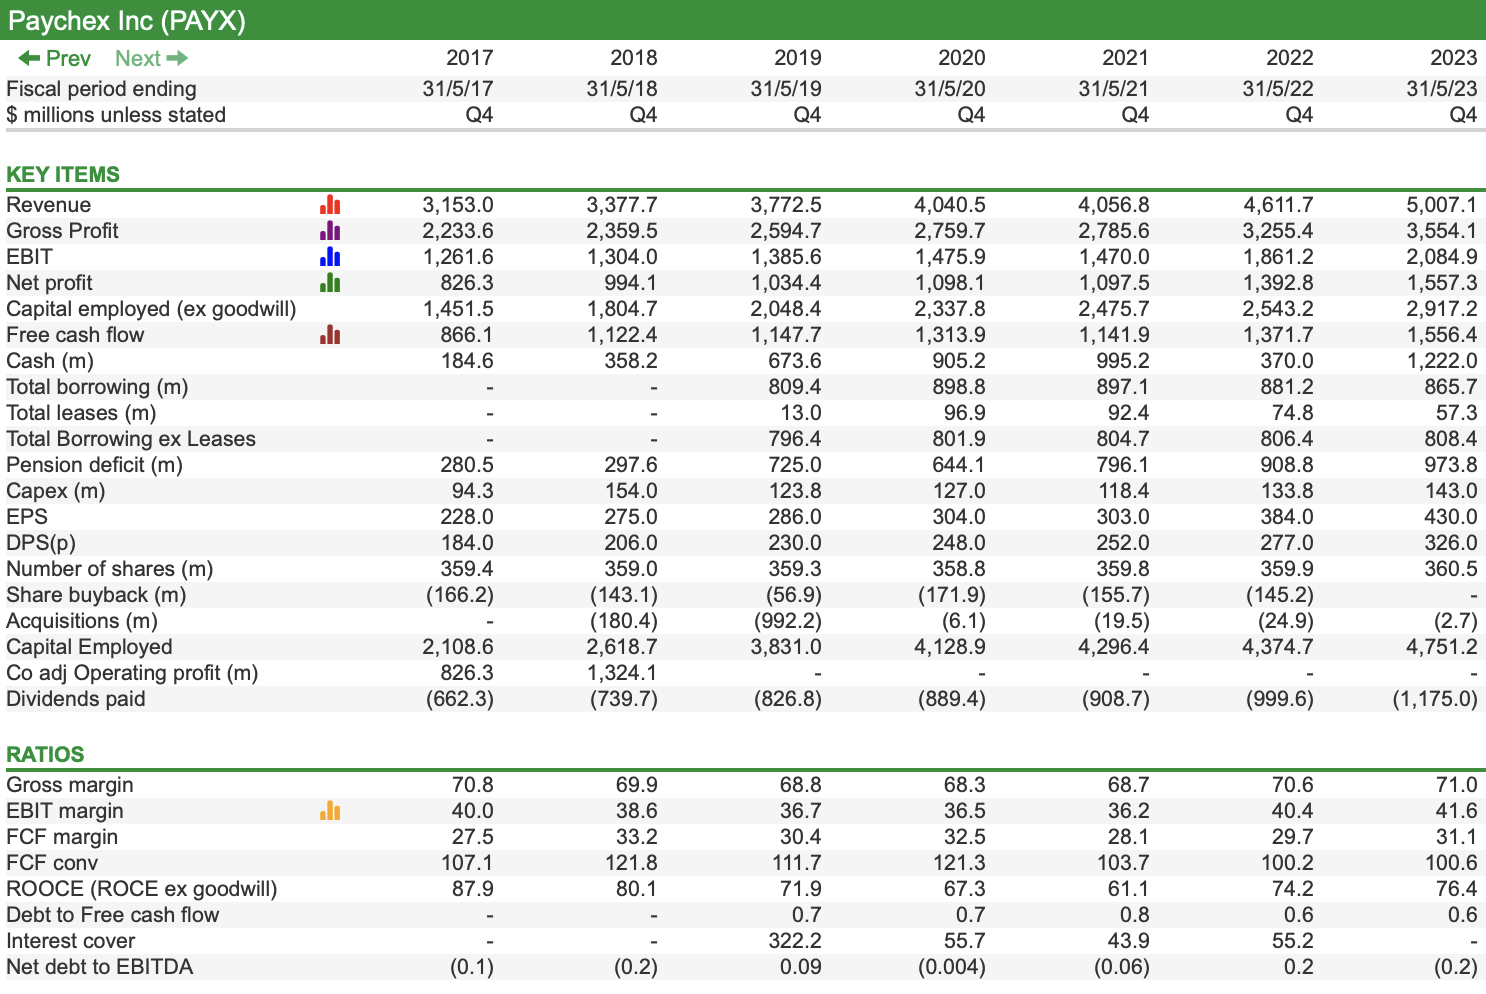
One of the great features of ShareScope is that it allows you to customise data so that you can focus on the details that you want to look at and ignore the ones you don’t need.
Here is a breakdown of Paychex’s key financial numbers and ratios between 2017 and 2023. If you wanted to, you could go back to 1994. The huge range of data available in ShareScope is really helpful in understanding how a company performs in economic recessions.
If it suffers badly then there is a good chance that it will do so in the next one unless it has made its business more resilient in the meantime. Knowing this is hugely valuable when picking shares for long-term investment. Resilient companies tend to be better investments than companies whose profits move from boom to bust.
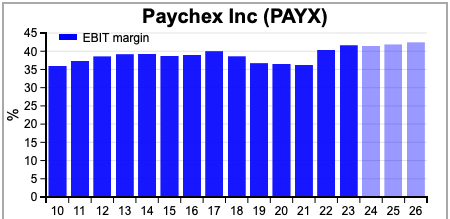
An even better way to quickly weigh up a company is to use ShareScope’s financial charting. The consistency of Paychex’s operating or EBIT margins and their high level is an encouraging sign of resilience and business quality.
The lighter coloured bars indicate forecast margins and you can see that they are currently expected to stay high which is always a good sign.
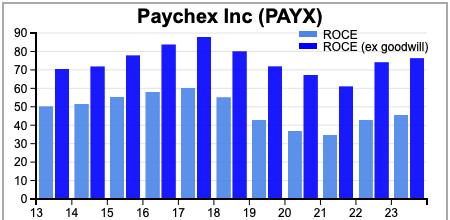
The quality and profitability of Paychex’s business is reinforced when looking at its return on capital employed (ROCE). This ratio expresses its trading profits as a percentage of the money invested in the business and can also be referred to as its return on invested capital (ROIC).
ROCE measures the return on all money invested. ROOCE measures the return on just the operating capital employed. Paychex has very high returns on both measures.
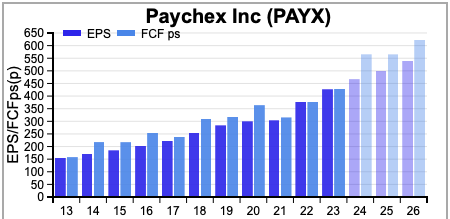
Another hallmark of a very good quality business is shown by its ability to turn a high proportion of its profits into free cash flow.
ShareScope allows you to compare a company’s earnings per share(EPS) with its free cash flow per share (FCFps) both historically and on a forecast basis.
Ideally, you want to see both EPS and FCFps growing and their bars on the charts very close together. This highlights that the company is turning a large chunk of its profits into free cash flow.
Paychex is a great example of a very good business in this respect.
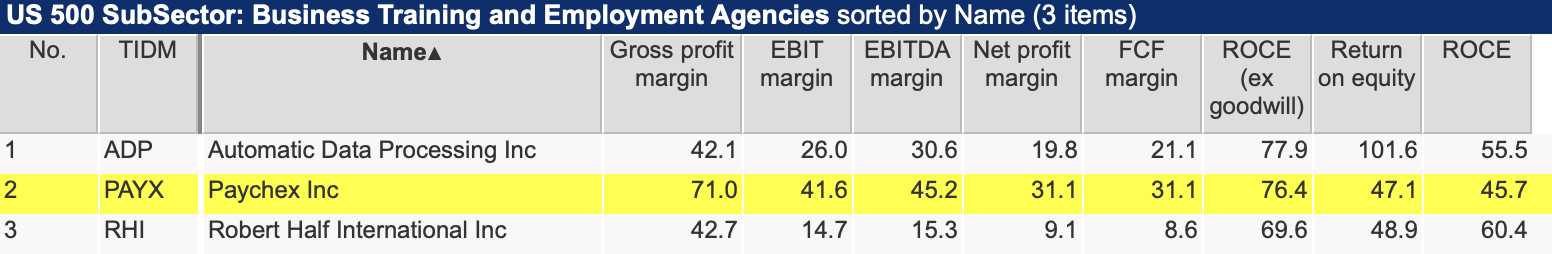
As you can with UK shares, ShareScope allows you to compare a company with others in its sector.
When it comes to profitability, Paychex is much more profitable on profit and free cash flow margins than its much bigger competitor, Automatic Data Processing. It earns similarly high returns on its operating capital employed (ROOCE).
Looking at the valuation of Paychex shares, we can see that they have a similar valuation to ADP.
To put Paychex’s valuation into some kind of perspective, ShareScope allows you to look at the history of its price-to-earnings or PE ratio. We can see that Paychex’s current valuation is nothing out of the ordinary compared to its long-term history.
ShareScope allows you to quickly see what Wall Street analysts think of Paychex. You can see the number of buy, sell and hold recommendations that they have along with the average target price compared with the current share price.
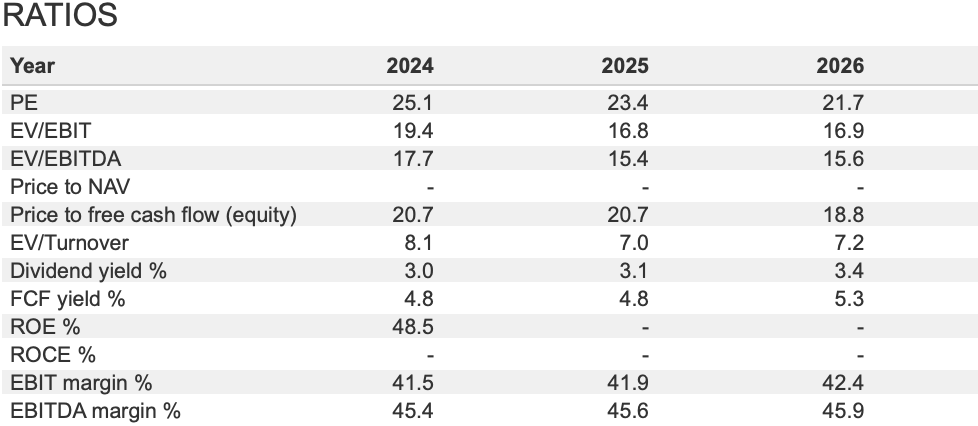
ShareScope also has some of the most comprehensive forecast data available to private investors. Instead of basic items such as revenues, pre-tax profit, earnings per share (EPS) and dividends per share (DPS), it provides useful forecasts on numbers such as free cash flow, capex and net borrowings.
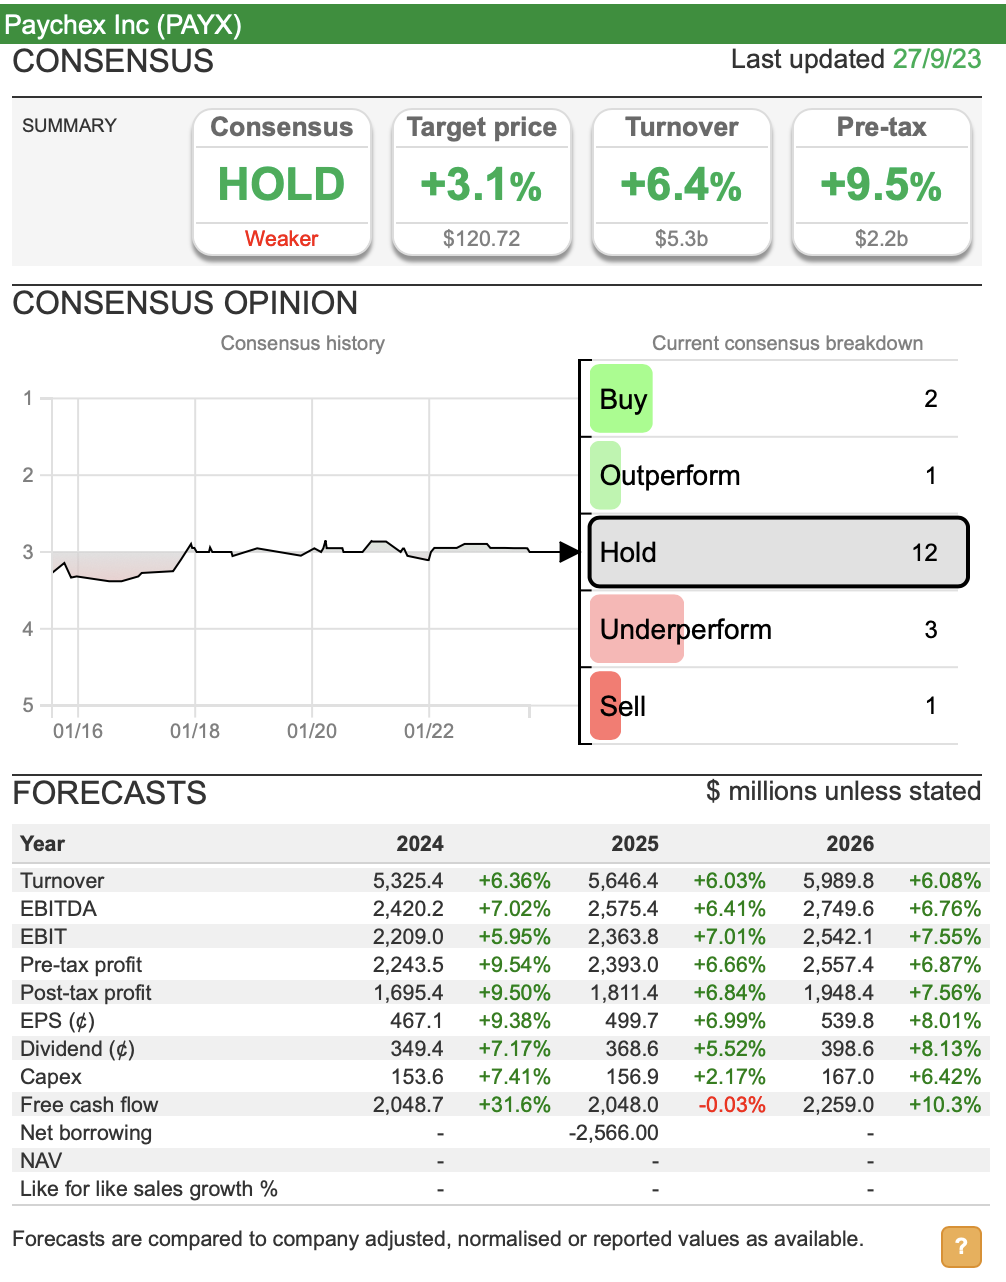
ShareScope then turns forecast data into forecast financial ratios so that you can see how analysts’ expectations are going to affect a company’s profitability and valuation.
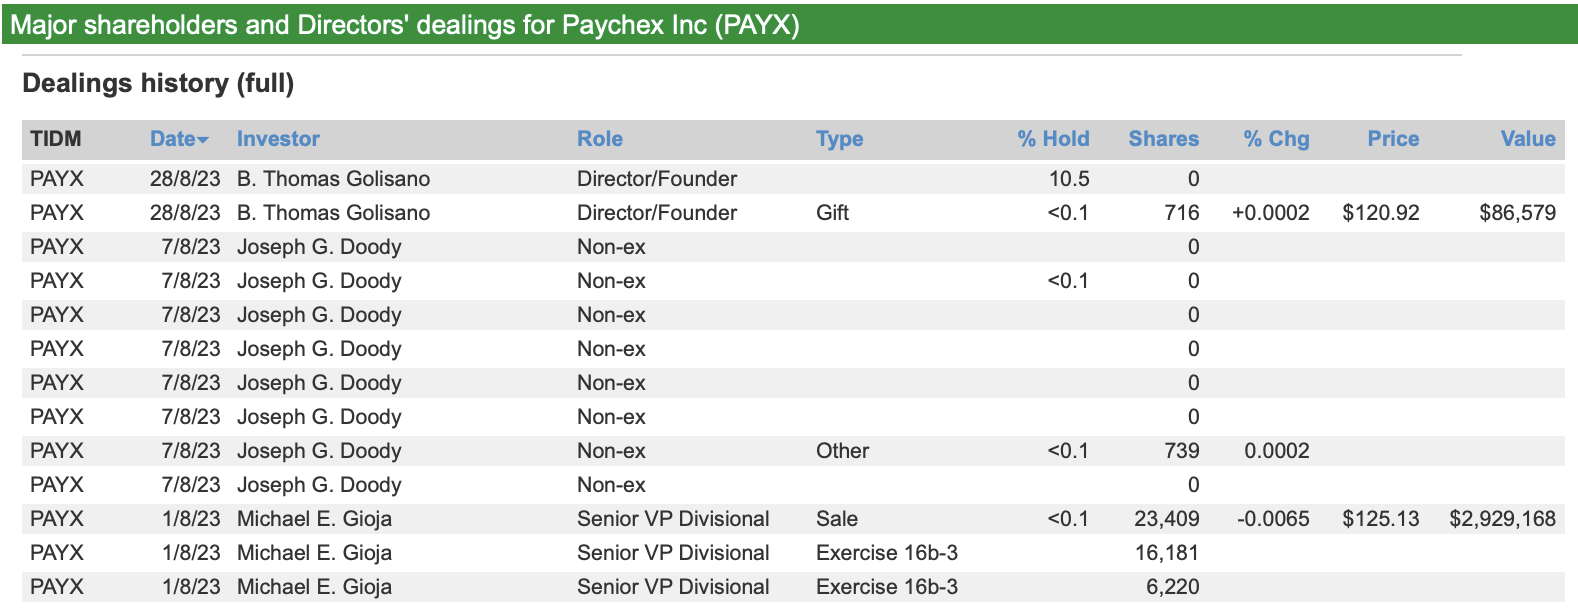
You can also check out whether the key directors of the company have been buying or selling shares.
Screening for US shares ideas
Once you have developed a filter in ShareScope you can apply it to any list of shares within the system. This makes it very easy to apply the screening criteria you have used in the UK to other markets such as the US.
Screening is a great way to generate ideas for further research. It is never wise to buy shares on the basis of screens. Take time to understand the business you are looking to buy a share of and you will take fewer risks.
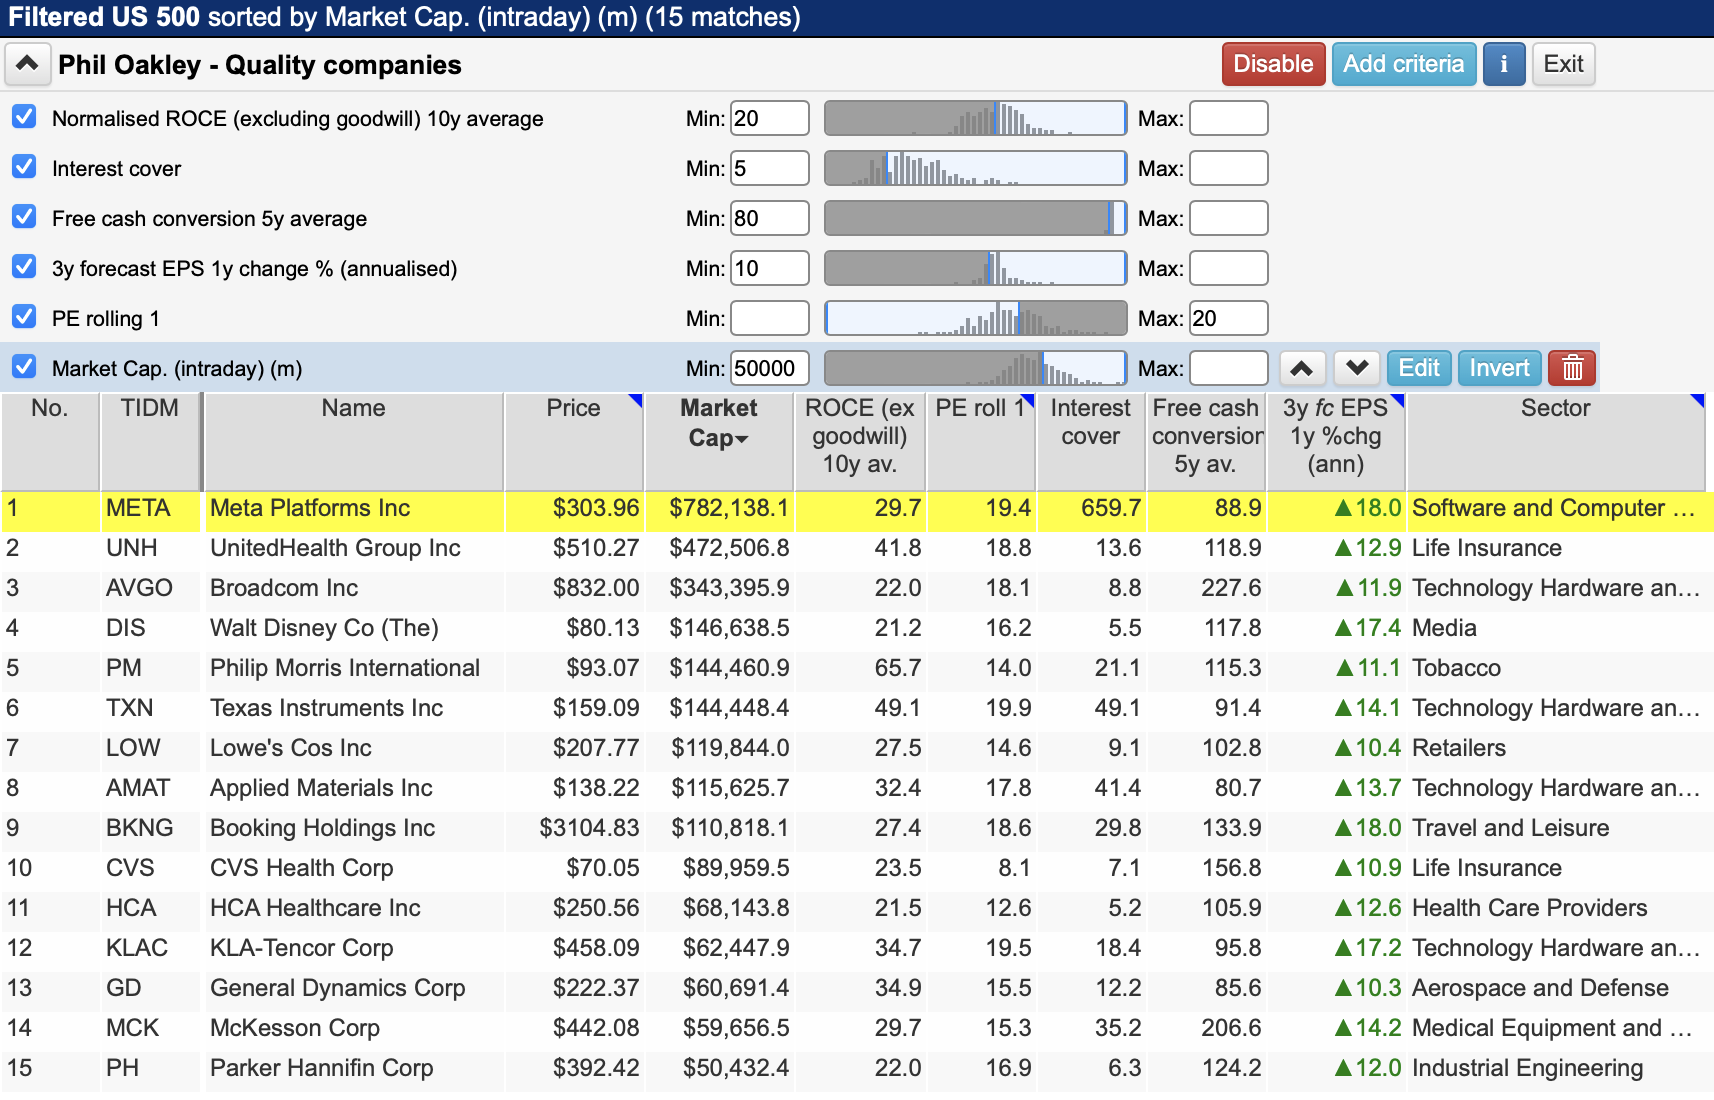
Looking for High-Quality companies
Here, we are looking for good companies, with strong financial positions, are good at turning their profits into free cash flow and are expected to grow their future earnings by a reasonable amount.
We do not want to pay too much for these companies and have set a maximum valuation at 20 times the next twelve months’ forecast EPS (or one-year forecast rolling EPS)
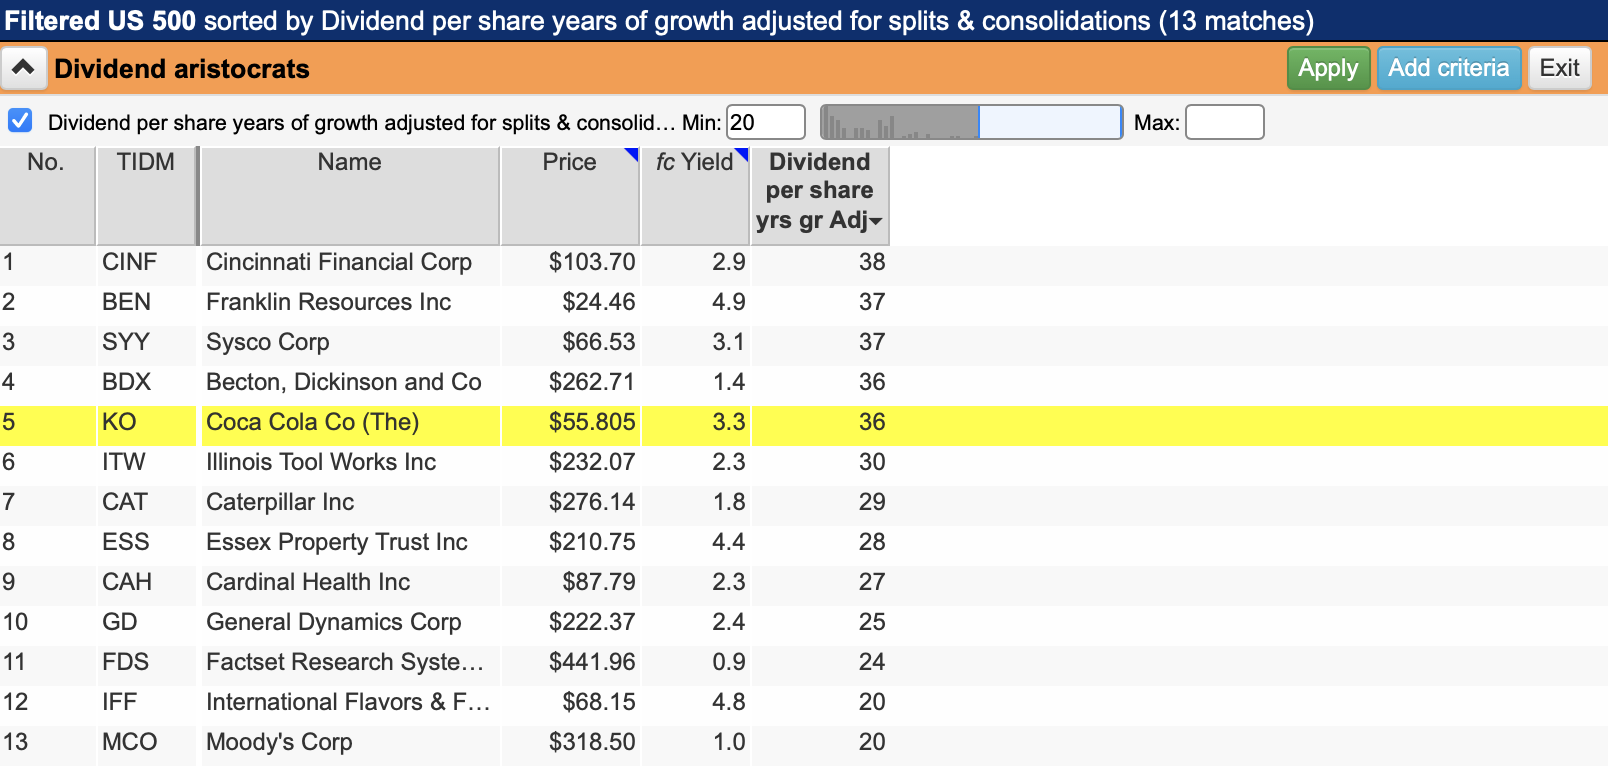
US Dividend aristocrats
Companies that have increased their dividends every year for long periods of time are few and far between. To have been able to do this through the ups and downs of an economic cycle may be telling investors that these companies are very robust.
As a result, they could be candidates for investors looking for safe and reliable dividend payers.
Here, we have looked for US companies in the US 500 which have increased their dividends for 20 consecutive years or more.
Cheap Shares with some earnings growth
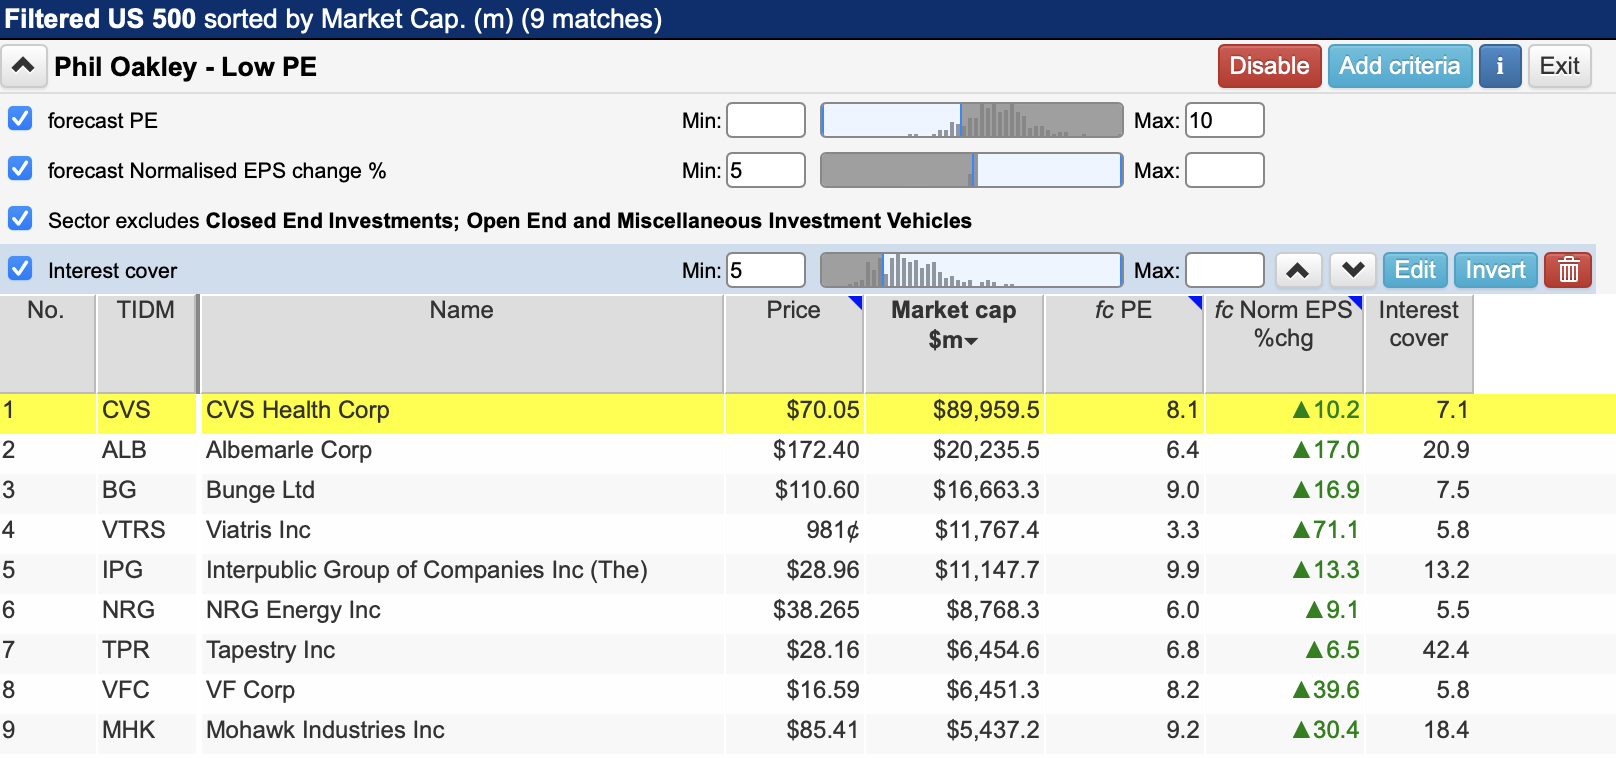
This is a very simple filter looking for shares trading on less than 10 times forecast earnings with at least 5 per cent forecast earnings per share (EPS) growth.
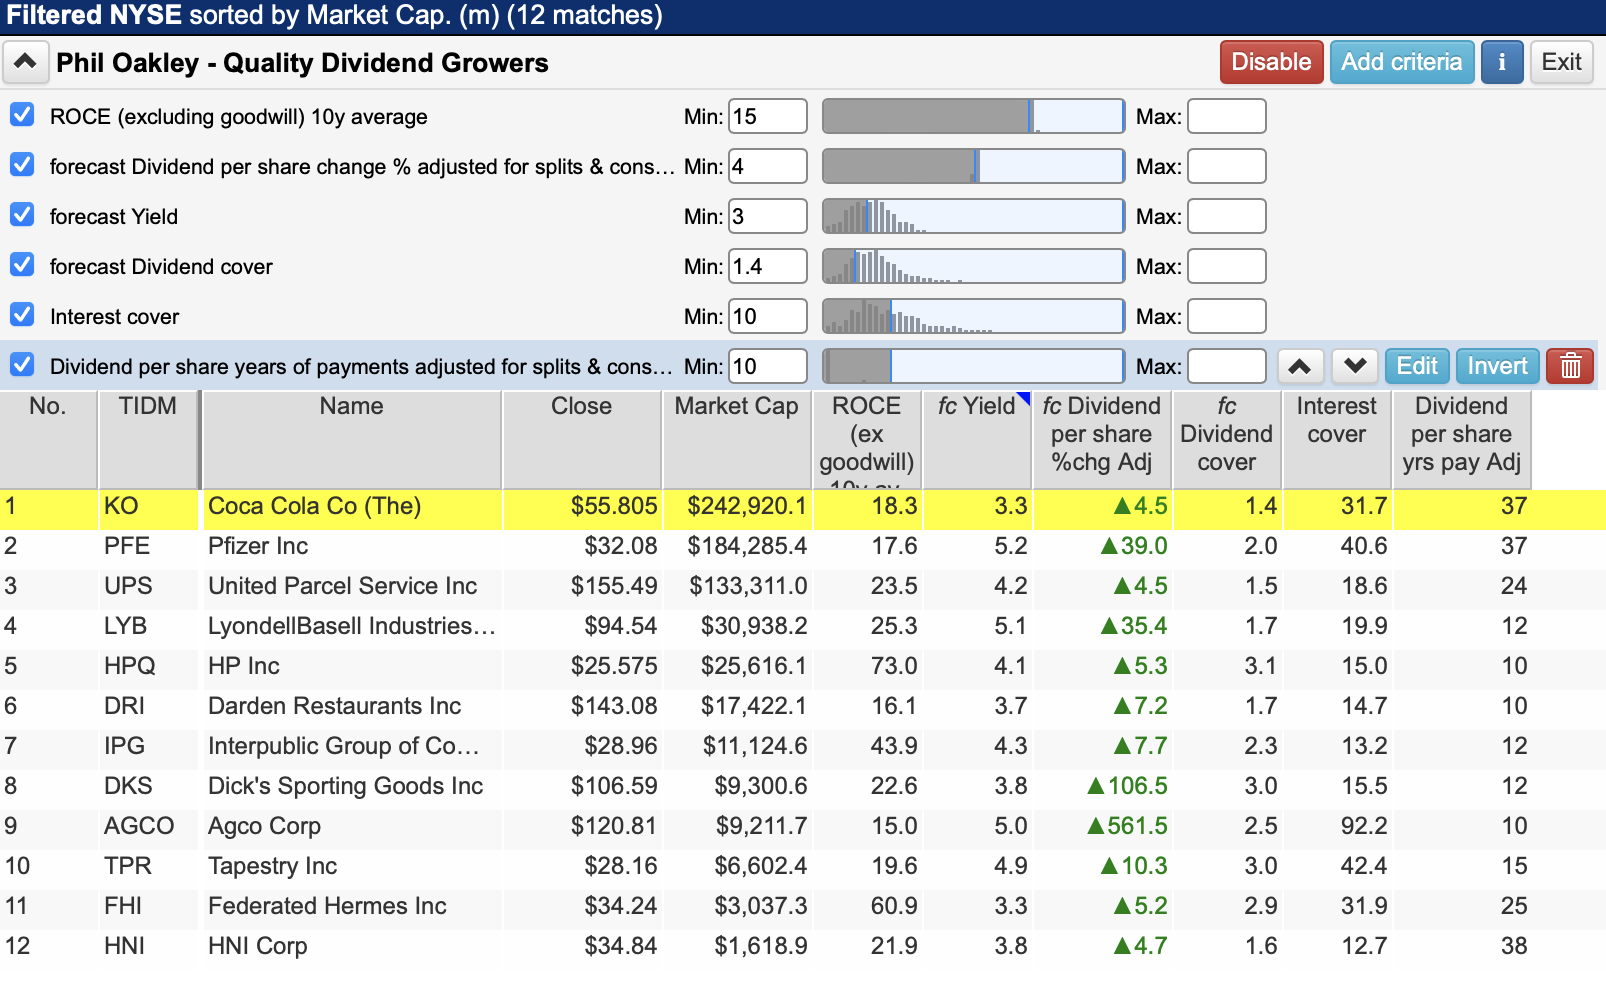
Quality dividend growers
This screen is trying to look for good companies that are already paying a reasonable dividend income – dividend yield – which have strong finances and are expected to to keep on growing their dividends.
Share buybacks
Share buybacks are controversial and often misunderstood. However, what seems to be true is that buying back shares when earnings are growing can turbocharge returns to shareholders.
Here we are looking for companies who have reduced their shares in issue by at least 10 per cent over the last five years. You can do this in ShareScope by setting a criteria for current shares to be at most 90 per cent of the number of shares five years ago.
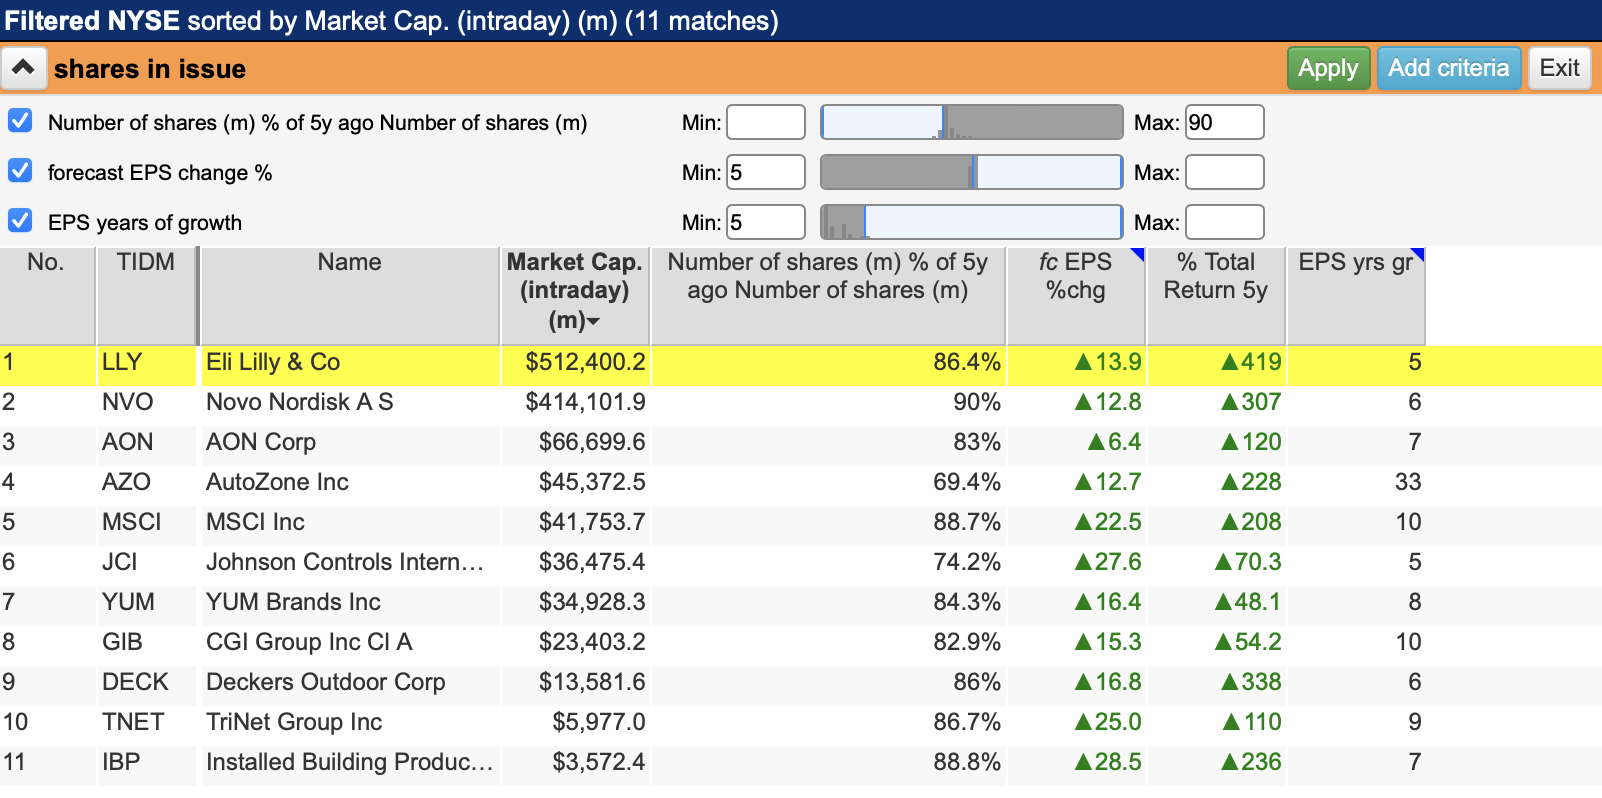
We have then looked for companies that have grown their EPS for at least five consecutive years and are expected to keep on growing them by at least 5 per cent over the next year.
The hope is that ShareScope will provide you with a list of decent companies. Whether they will remain so is part of your research effort.
Looking at the list of shares and the five-year total returns you can see that buybacks have probably not done much harm to shareholders.
Phil Oakley
Got some thoughts about this article? Share these in the comment section below.
Not subscribed to ShareScope before? Click here to find out how ShareScope can make you a better investor.
This article is for educational purposes only. It is not a recommendation to buy or sell shares or other investments. Do your own research before buying or selling any investment or seek professional financial advice.


Very good article. I have used Sharescope for over 20 years and am trying to switch to Sharepad, so I would have liked a bit of information on how to access some of the tables and graphs which don’t indicate their source. I found it all eventually.
One other point: I have never really understood why ROCE matters much to an investor buying shares in the market. The capital is already invested in the company and so does it matter whether it earns a high or low rate of return on that capital, so long as it earns? What matters to me are the profits, the profit growth and whether I am getting value for money in a sound company. Just a thought.