
This month our funds expert focuses on ETFs and the listed hedge fund BH Macro. He looks at why you’d be better off investing in a small handful AI related stocks rather than AI ETFS and also looks at two new defensive-oriented ETF trackers, with one focused on covered call options writing. He also investigates a NATO-oriented new ETF and then looks at why the classic defensive listed hedge fund BH Macro might have underperformed in recent months.
AI ETFs
Over the last few years, we’ve seen an explosion of exchange-traded, index-tracking funds based around a particular theme. These thematic ETFs, as they are called, allow investors to buy into a particular sub-sector or more usually a cross-section of subsectors where some form of driver is a big trend. One of the earliest pioneers in this space was the LGIM ETF business with its robotics ETF but over time, we’ve seen thematic ETFs emerge all over the place, ranging from renewables (clean energy) through to AI. It’s that last theme that’s worth dwelling on for a moment.
The great selling point for thematic ETFs is that traditional sectors as defined by index developers (such as S&P and FTSE) tend to be a bit rigid and old school. AI developments span everything from social media companies (usually part of telecom services classifications) to hardware-based IT. In a traditional sector ETF, you’ll struggle to have exposure to all those types of business, but a thematic index that spans sub-sectors and has a more active index construction approach can deliver a more focused result, usually with a concentrated stock portfolio – a typical portfolio might only have between 25 and 50 individual stocks.
Critics of this approach have tended to focus on two key arguments. The first is that all this active index work tends to result in higher costs (more trading) and greater volatility when compared to a traditional, broad, passive index such as the SP 500. This argument says that rather than take concentrated, undiversified bets, it’s better to build a boring, big, diversified portfolio of different sectors i.e be diversified across many sectors rather than pick sub-sectors.
The second criticism is that frequently these thematic indices are technology-based and that in reality, the primary driver of returns is actually broad tech sector momentum rather than any specific theme. In this criticism, if you want AI exposure, why not buy a broad US tech sector index tracker which is far more diversified?
I’ve long harboured a very different worry. This is that a better bet is rather than buy a basket of say 25 to 50 thematically inspired stocks wrapped up in an ETF, why not buy a handful – max three – mega large-cap stocks that exemplify this theme? So, with AI, rather than buy an AI ETF, why not buy Nvidia, Microsoft and Meta Platforms? These three are already profitable, clearly involved in AI, with highly traded stocks, boasting deep liquidity and mountains of research material available to dig around in.
In the table below I have looked at returns for a series of AI-related ETFs over a number of periods, most notably since the beginning of the year. The average return YTD for these ETFs is 32% whereas the three stock basket I suggested has returned (helped by Nvidia’s rocketing share price) an average 130% return. Over 1 year it’s 21% for ETFs vs 87% for the three-stock basket and over three years it’s 33% for the ETFs vs 144% for the three-stock basket.
I’m completely aware that I’m using one narrow example here which has been flattered by the amazing performance of Nvidia – by contrast the funds are vastly more diversified in their holdings. But my point is simple. In many cases though not all, many investors use thematic ETFs to capture a momentum trade rather than make any great long-term bet on a big trend. In this respect what these trend-following investors really care about less is the risk profile and more the upside leverage. In that case, in my experience, a simple 1 to 3 stock basket approach of mega large caps works can frequently be much better in the short term (defined as under 6 months).
| TIDM | Name | Price | YTD % | 1 yr | 3 yr | 5 yr |
| AI and robotics ETFs | ||||||
| ROBG | L&G ROBO Global Robotics and Automation UCITS ETF | 1834p | 19.5 | 13.5 | 30 | 51.4 |
| RBOD | iShares Automat & Rbot UCITS USD (Dist) | 811.375¢ | 27.9 | 21.3 | 31.3 | 52.3 |
| INTL | WisdomTree AI UCITS ETF USD Acc | 4501.25p | 36 | 14.1 | 44.7 | |
| BOTZ | Global X Robotics & Artificial Intelligence UCITS ETF | 1898.8¢ | 41.5 | 31.9 | ||
| WTEC | SPDR MSCI World Technology UCITS ETF | 12330¢ | 41.3 | 27.4 | 56 | 124 |
| AIAG | Legal & General Artificial Intelligence UCITS ETF | 1265.4p | 32.6 | 19.5 | 21.8 | |
| PLSWCUSD | Polar Capital Funds PLC – Artificial Intelligence Fund I Acc | 1765¢ | 30.2 | 21.7 | 21.6 | 63.3 |
| Individual Stocks | ||||||
| NVDA | NVIDIA Corp | 44269.5¢ | 203 | 156 | 334 | 612 |
| MSFT | Microsoft Corp | 34417¢ | 44.1 | 32.2 | 71 | 220 |
| META | Meta Platforms Inc | 29339.5¢ | 144 | 73.3 | 27.2 | 36.7 |
| Tech Index benchmark | ||||||
| SP500TLIT | S&P 500 Telecom & IT Index | 1871.19 | 41.6 | 28.3 | 62.6 | 127 |
New ETFs
Despite my cautions above, I wouldn’t want to give the impression that I’m opposed to all things ETF and thematic-related. Far from it – there are some fantastic boring ETFs (big, main market, low cost) as well as some exciting new ETFs allowing you to capture a long-term thematic approach that deserves attention. For the more defensive investor I would particularly highlight a handful of three new ETFs that have emerged in recent weeks – I’ll look at one of them, a defence ETF, in the following section but next up I want to highlight two ETFs that might appeal to more ‘defensive’ investors.
The first is a very narrow, focused sector-specific play, namely investing in big US insurance businesses. The ETF is called the Invesco Dow Jones US Insurance UCITS ETF (INSU) and it boasts a total expense ratio (TER)) of 0.35%. There’s already a small number of existing ETFs that track insurance companies featured in STOXX Europe 600 index, whereas INSU is distinguished by its focus on US stocks via the Dow Jones US Select Insurance index of 56 US-based companies involved in full-line, property, casualty and life insurance. In this narrow space, its nearest peer is the $367m iShares US Insurance ETF (IAK) listed in the US in 2006.
So, why go for insurance? In simple terms, it’s a classic defensive equities sector, full of companies that do well – rather than spectacularly – in a bull market and outperform in a sideways-moving or bearish market. Usually, they boast decent balance sheets and defensive dividends. They’re also usually fairly big in market cap terms – the strategy allocates almost 30% of its weight to just three names: Chubb, Progressive Corporation and Arthur J Gallagher.
Another more explicitly defensive idea is from ETF firm Global X and called the Global X S&P 500 Covered Call UCITS ETF (XYLU) with a total expense ratio (TER) of 0.45% – this new fund already has a sister fund called the Global X Nasdaq 100 Covered Call UCITS ETF (QYLD) in November last year.
The idea here is a well-established one – equity exposure wrapped around by a defensive options strategy which produces an increased income in times of volatility. The ETF is designed to generate steady income during periods of volatility by selling covered call options with underlying exposure to the S&P 500.
These covered call funds are an interesting option in sideways-moving markets because even if the equity basket isn’t moving up, the income generated by the covered call writing strategy produces a useful return – this also helps limit downside losses.
How does it work? The strategy is constructed around a ‘long’ exposure to the S&P 500 NTR 15% USD index, and a short on the S&P 500 Call option, expiring monthly. The income generated by the options writing is either retained for capital growth or a maximum of 1% is paid out via the distribution class. I.e. Investors in the distributing share class will receive half of the premium up to 1% every month. For example, if the ETF receives a 3% premium from selling at the money option the ETF will pay out 1% with the remaining 2% reinvested. According to the industry news website etfstream.com, “premiums received over the past couple of years for the US equivalent ETF were 14.5% so far in 2023 and 30% in 2022.” One obvious caveat is worth noting – in a bull market, this strategy will underperform. ETF Stream reports that the index the ETF uses underperformed the S&P by 2.25% a year before fees since 1986.
Defense ETFs
The recent NATO conference represents a big pivot in NATO, as the Western powers work out how to restructure their defence posture against the Russians – and in the future maybe the Chinese. With all the heads of state in Vilnius, it’s a great time thus to launch a NATO-themed exchange-traded fund or ETF. HANetf, never one to miss a good marketing opportunity, have risen to the challenge and brought out an ETF with the ticker NATO aka the Future of Defence UCITS ETF (ticker: NATO) which has just launched on the London Stock Exchange.
The sales pitch here is predictable and features the usual stuff about NATO’s community-wide commitment to a 2% GDP defence spend (which has always struck me as woefully inadequate given the very real, multiple threats). Arguably a more convincing pitch is the HANetf survey which revealed that 78% of wealth managers now place increased emphasis on geopolitics – quite right too! Ian Bremner has been popularising talk of a geopolitical recession which I think is a very real risk. HANetf is too polite to mention another driver – as ESG has turned into marketing hype, investors have been exiting defence firms because they don’t tick the ESG boxes (a ludicrous and undefendable state of affairs – refuse to invest in companies that defend democracy).
Moving away from the political realm, defence ETFs – and there are plenty in the US – tend to have a strong sectoral vibe about them. They are in reality a crossover between industrial and tech hardware stocks, with a strong aerospace vibe. There’s also a strong link to government spending and as that is likely to increase over the next decade, then they will be beneficiaries. I would also add that the military-industrial complex is a classic example of a series of mega-scale oligopoly players who have become experts at milking taxpayers for every last penny.
As we’ll discuss in relation to the US ETFs in this space, valuations are fairly ripe. iShares in the US has a large aerospace and defence ETF which trades on a PE of 26 times earnings (gulp) after gaining 18.20% in value in the last 12 months. Back here in Europe, HANetf’s product is a variation on this theme with the extra tech hardware element added on, plus a strong dose of cyber security in there as well. Here’s the blurb about the fund:
“The EQM Future of Defence Index (NATONTR), is designed to provide defence exposure by investing in global companies generating revenues from NATO and non-NATO ally defence and cyber defence spending. Using a passive, rules-based approach, companies must derive more than 60% of their revenues from the manufacturing and development of: military aircraft and/or defence equipment, such as:
– Military armoured vehicles & tanks,
– Weapon systems and missiles,
– Munitions and accessories,
– Electronics & mission systems,
– Naval ships;
– or have business operations in cyber security, contracted with a NATO+ member country.”
The final eligible universe is constructed after the application of the following screens and filters:
– Constituent business operations must derive more than 50% of their revenues from the manufacture and development of military aircraft and/or defence equipment.
– Constituent business operations in cyber security, contracted with a NATO+ member country.
– Constituents must be at least $1 billion USD in market capitalization.
– Constituents must have an average daily traded value of at least $1 million USD over the last three months.
– Maximum country weighting is 50% in aggregate.
– Constituent business operations must be in compliance with United Nation Global Compact (UNGC) principles and Organisation for Economic Cooperation (OECD) Guidelines for Multinational Enterprises and determined by the Index Provider.
The tables below show the main holdings which have, as I mentioned above, a strong cyber and IT tech theme running through them: top stocks include data infra specialist Broadcom, cyber security firm Check Point, and Trend Micro.
NATO Index Indicative Top 10 Holdings


Source: EQM Indexes. Index data as of 15.06.2023.
The HANetf NATO product isn’t the only fund in Europe – VanEck also has its own Défence ETF which has a similar Tech vibe about it with top holdings including Palantir. It has collected a decent $40m in assets and launched at the end of March 2023. There are 29 stocks in the portfolio and the TER is 0.55%. More details are below.

Over in the US, there is a multitude of ETFs – in the table below I’ve featured three of the biggest aerospace and defence ETFs starting with that iShares vehicle. Notice that all these have a more traditional mega large cap military industrial flavour to them with big holdings consisting of Raytheon, Boeing, Lockheed Martin, Northrop, and TransDigm.
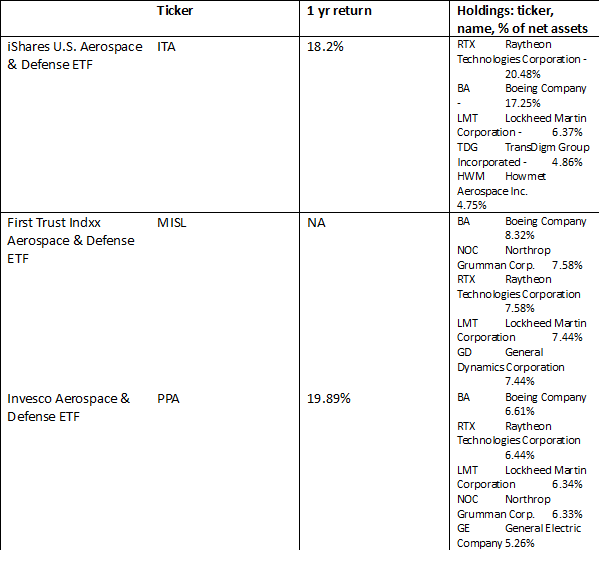
My take? I absolutely do think we will see a multi-decade uptick in defence spending and that more of that money will go to tech hardware and software. I also think Europe will see the biggest quantum of increase as it faces the biggest threat (Russia). But I would make a couple of observations. The first is that for the reasons discussed above, most of that money will go to the traditional mega large cap military industrial players like Boeing in the US or Bae in the UK. In addition, I also think that much of the current ramp-up is already in the price for many of the defense majors and that the upside in share terms has already kicked in. That said, if things get really hot with China, we could see a quantum increase and all bets are off.
What happened to BH Macro?
I’ve long championed the listed hedge fund BH Macro as a great portfolio diversifier and provider of downside protection in volatile markets. For much of 2021 and 2022, the fund provided precisely that as markets yoyo’d down and up and down again. But in recent months the share price has come aggressively off the boil, slipping from a chunky premium to a discount of 3% (for the £ shares). The chart below shows the steady deterioration in the share price (the red line shows the 20-day MA, the blue line the 200-day MA). In the last week though BH Macro’s shares did stage a small rally – increasing by around 10% in a matter of a few days.

What’s going on? The obvious thing to say is that it’s always difficult to get a firm steer on the black box proprietary strategies used by this well-known hedge fund.
First though some hard numbers; according to Numis, NAV returns have been -6.5% YTD and -3% over the last 12 months. On a month-by-month basis in terms of NAV, there were gains in January but since then trading has worsened: there was a big loss of -4.29% in March and -1.62% in May. These negative numbers followed a big gain of 21.81% in 2022. On a strategy-by-strategy basis, according to the shareholder report from May, most seemed to be losing money including rates, FX and commodities, and equity, with the smallest losses in credit. Overall the key message is that the macro-oriented strategies seem to be underperforming – the reversal of interest rate expectations seems to have hit BH Macro hard.
Here’s the manager’s own short but sweet summary:
“Interest rate, FX and to a lesser extent inflation trading generated losses over the month with GBP rates, DM FX and US real rates as the main drivers. Additional small losses stemmed from European rates, energy and precious metal trading, emerging market corporates and digital assets, while small gains were generated in volatility and equity index trading.”
– Macro Style – Losses on GBP rates, DM FX, precious metals, US real yields, EM corporate debt with smaller, partially offsetting gains on tactical US equity indices and LatAM rates.
– Alpha Style – Losses on USD, EUR, GBP rates, smaller losses on US equities and US agency mortgages, with gains on EM and JPY rates, US inflation.
On a very superficial level, the chart below might help explain the challenge – volatility levels have fallen sharply. The chart below shows the Vix, a measure of turbulence in US equities. Other measures of volatility such as FX show similar declines although bond volatility has picked up.
On a very simplistic level, one could say that many multi-strategy investors correctly worked out that we are at a turning point in terms of markets and economies but they underestimated the optimism of equity investors and the US consumer. As US equities have powered ahead, helped by those US consumers, equity volatility has collapsed. The contrarian in me thinks this lull in market turbulence is completely unwarranted but I’d wager that the equity bulls have plenty more energy left and US equities could push higher. If that is the case, outfits like BH Macro might continue to struggle.
Chart: Vix since 2020 – blue line 200-day moving average, red line 20-day moving average. Long term average is around 19 to 20. At current pricing of 13.4, Vix is below the 20 and 200-day MA.

On a more positive note, I’d note that most defensive, multi-strategy funds have had a very tough H1, with many experiencing losses, some of them much greater than BH Macro. And I’d also agree with Kepler Research’s own observation: “Over the long term, BHMG has delivered attractive returns, both on absolute and risk-adjusted bases. Since the trust’s IPO in 2007 to the end of December 2022, the sterling NAV total return has been 9.45% per annum, with a volatility of 8.14%. This gives the trust a Sharpe ratio of 1.03, according to Brevan Howard.”
David Stevenson
Got some thoughts on this week’s article from David? Share these in the SharePad chat. Login to SharePad – click on the chat icon in the top right – select or search for ‘share chat’.
This article is for educational purposes only. It is not a recommendation to buy or sell shares or other investments. Do your own research before buying or selling any investment or seek professional financial advice.


