
In this article I want to run through some interesting areas I’m seeing in the markets by zooming out of the day-to-day noise to get a more meaningful big picture viewpoint.
Big Picture Levels
The markets are currently in a correction that is testing our patience, sit-out power, and also giving our risk management a thorough workout. Trailing stops were executed in outliers from the previous bull leg months ago and very little has happened since.
Is the bottom near?
There’s so much prediction out there in the media world at the moment as everyone has an opinion on where the market is going from here. I’m just going to run through my own big-picture market levels that might or might not come into play. The truth is it doesn’t matter how accurate the guestimate is. It’s just good practice to have some big picture areas to anchor to when it comes to allocating risk in the coming months.
How Will We Know When To Buy?
Being a long breakout trader has its strengths in a correction as we don’t see many opportunities in down markets. The stocks that are breaking out at the moment have been mainly limited to oil and gas and the sector is one of few trending at the moment. Another thing to note is that all correlations have broken down and something will likely give moving forward but I’ll let you make your own minds up after studying the charts below. The more important point I want to get across is we don’t need to predict what will happen. We just have to follow along. Price will lead and my job is not to question it. When the stocks start to hit the breakout screens, I will then start to get on board.
Patience Is Key
The focus will be on running through the sharescope screens every night noting what sectors are starting to populate and make themselves known. It will be gradual at first and we will start to see basing action from stocks under institutional accumulation. I don’t have a timeframe. This game isn’t about predicting anything. It’s about routinely going through the motions day after day. When they show up I will be ready.
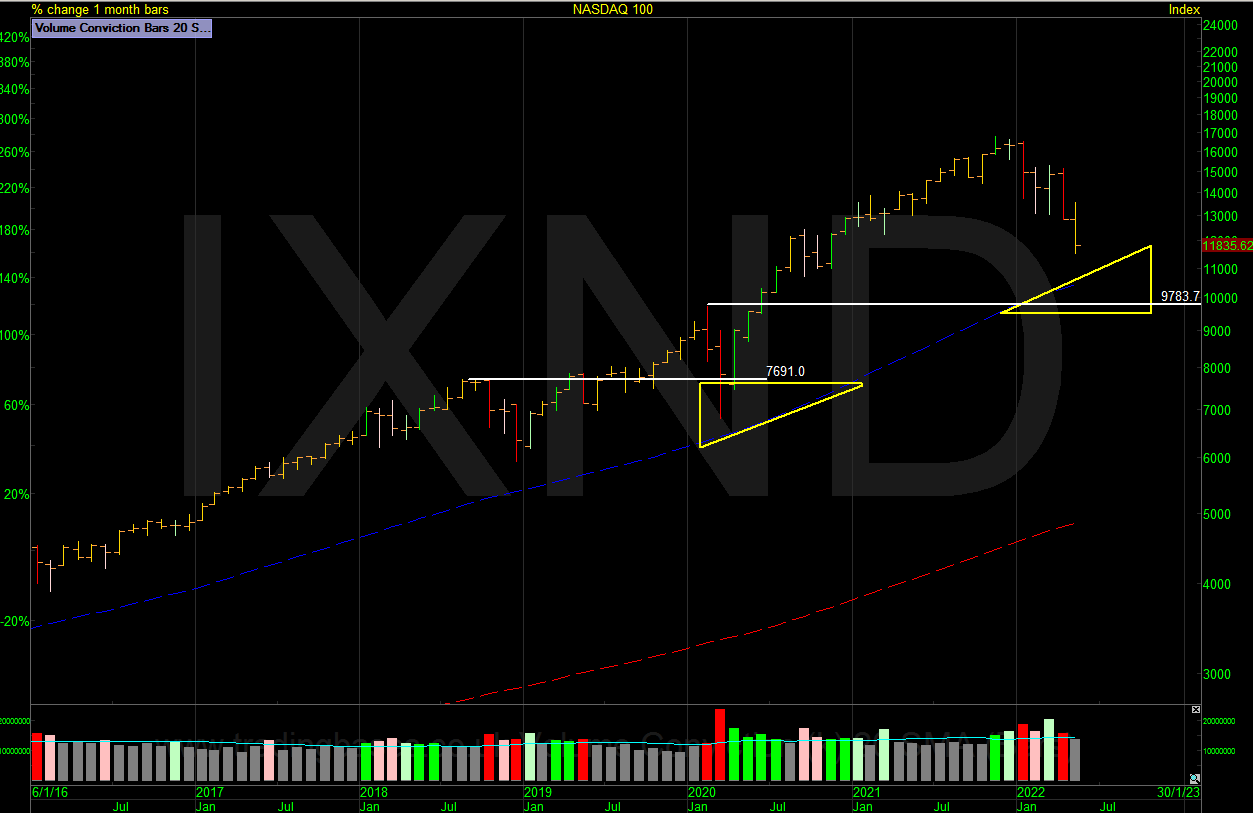
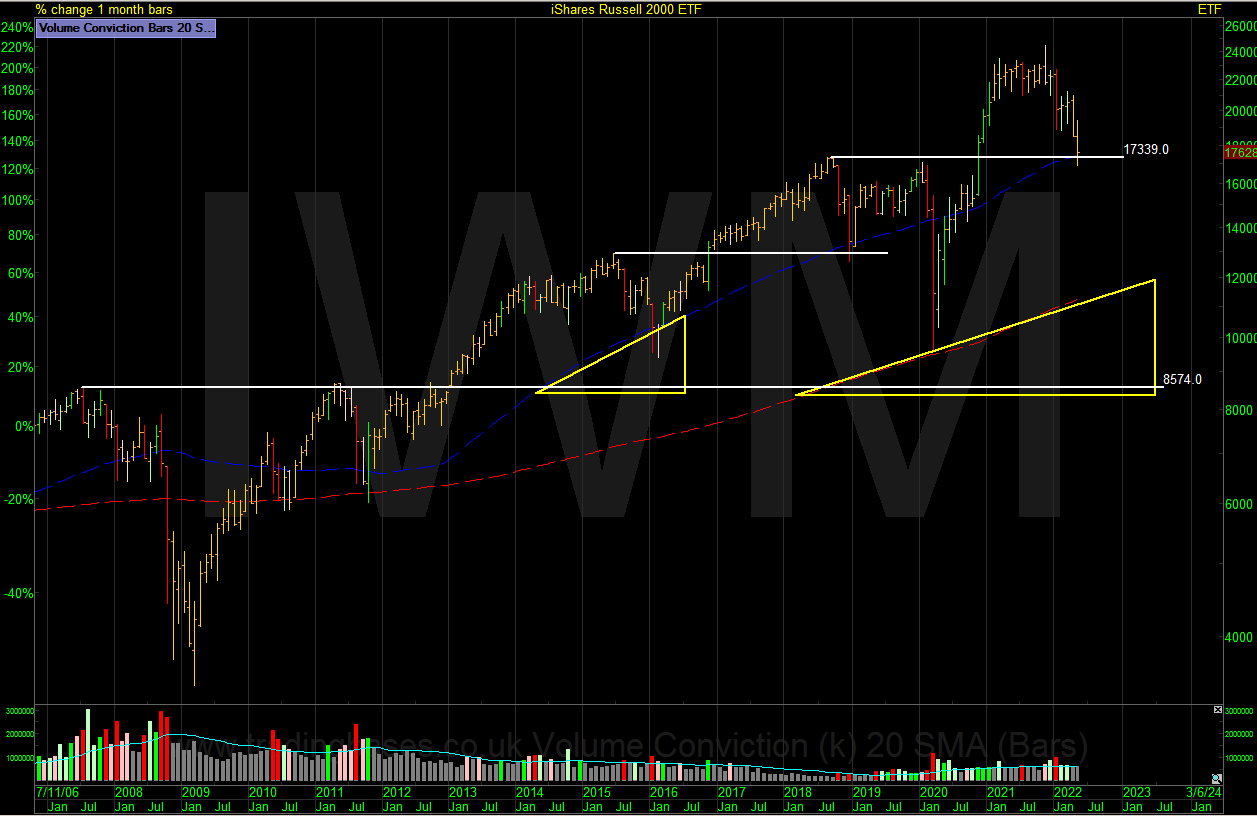
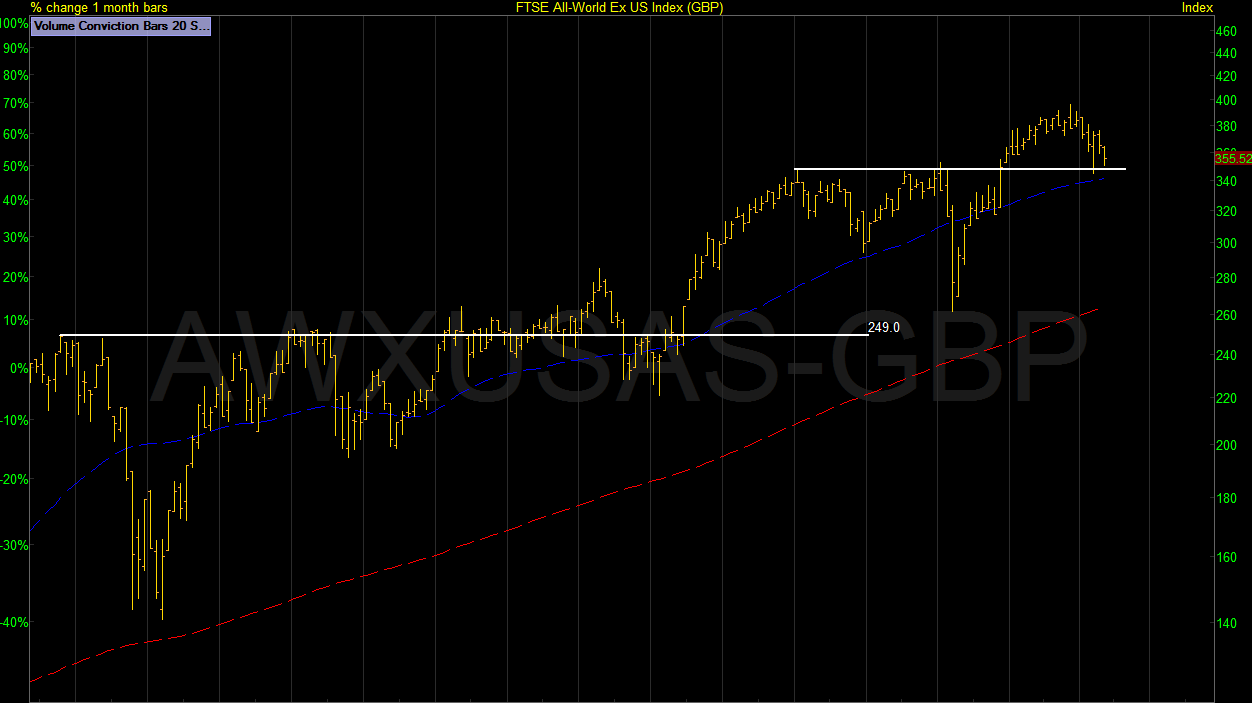
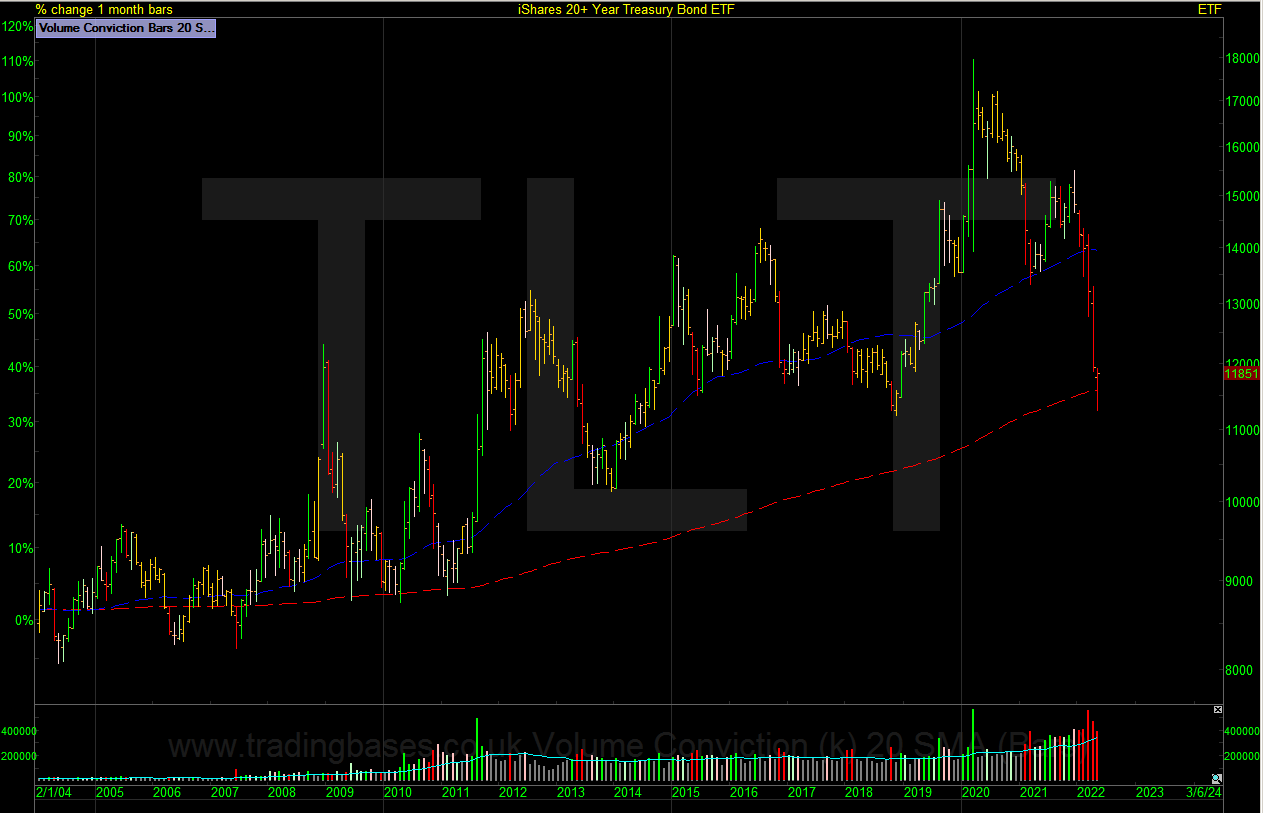
Big Picture Levels
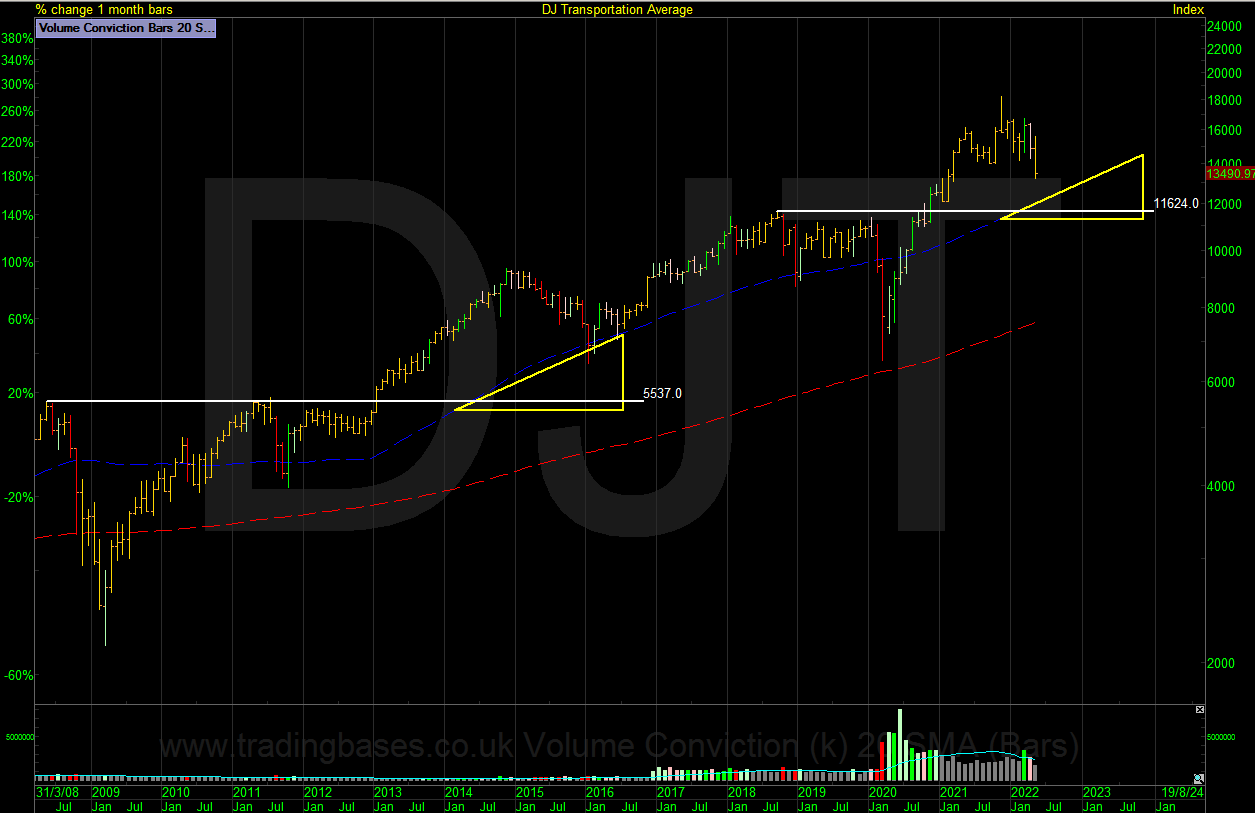
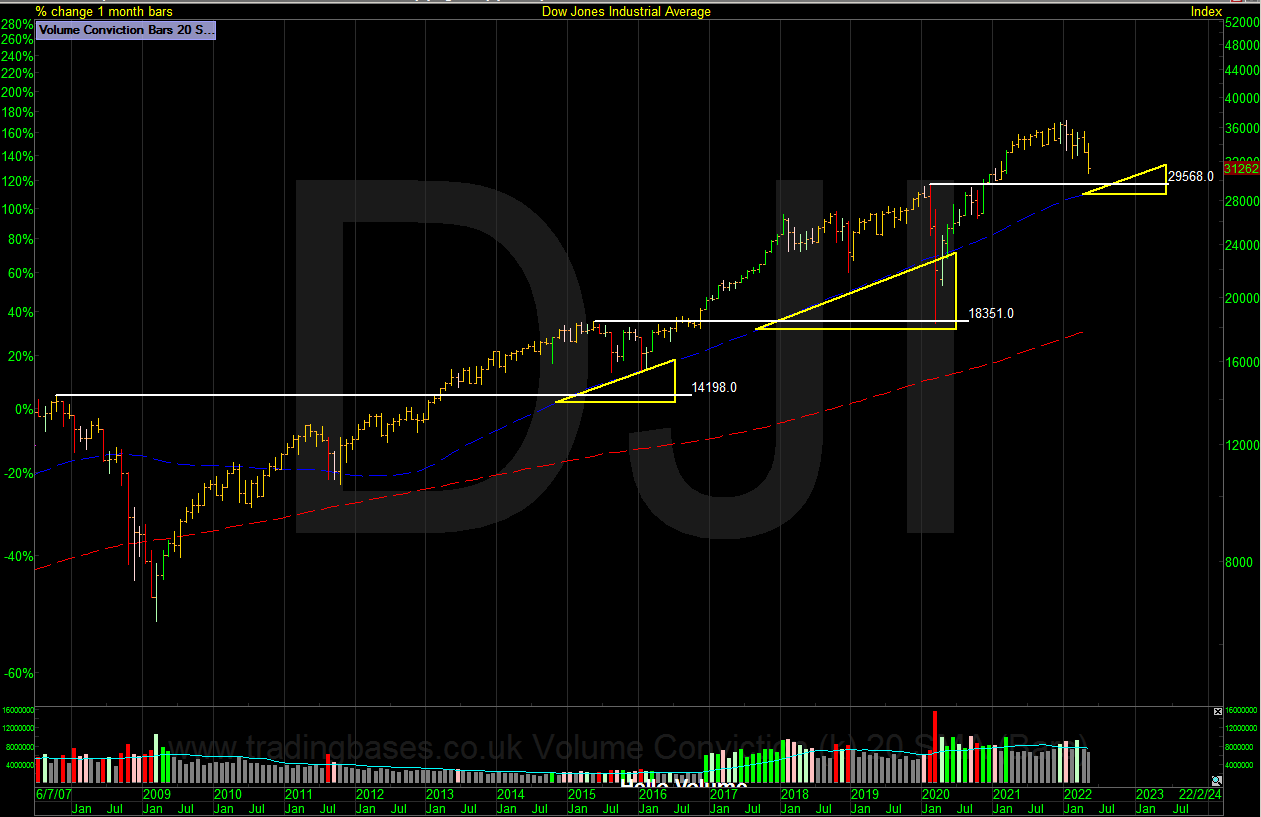
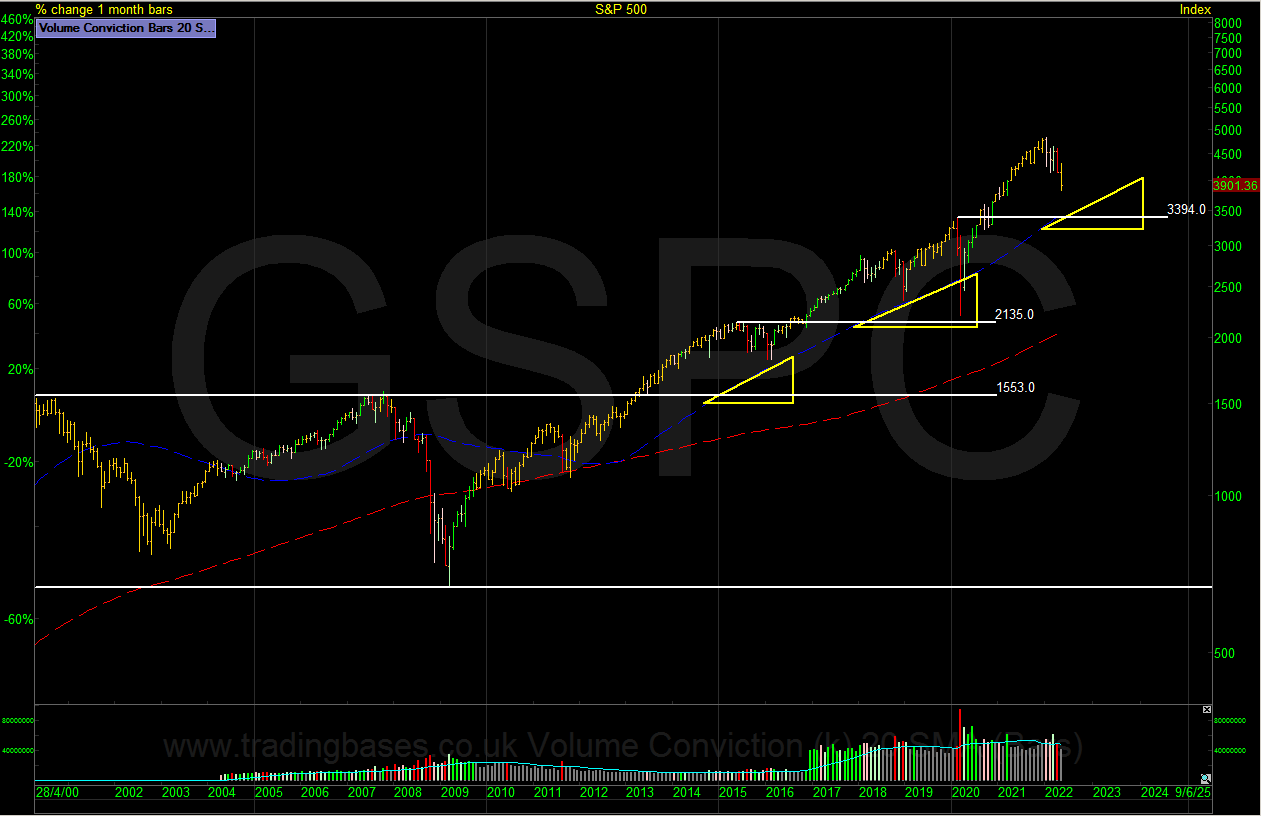
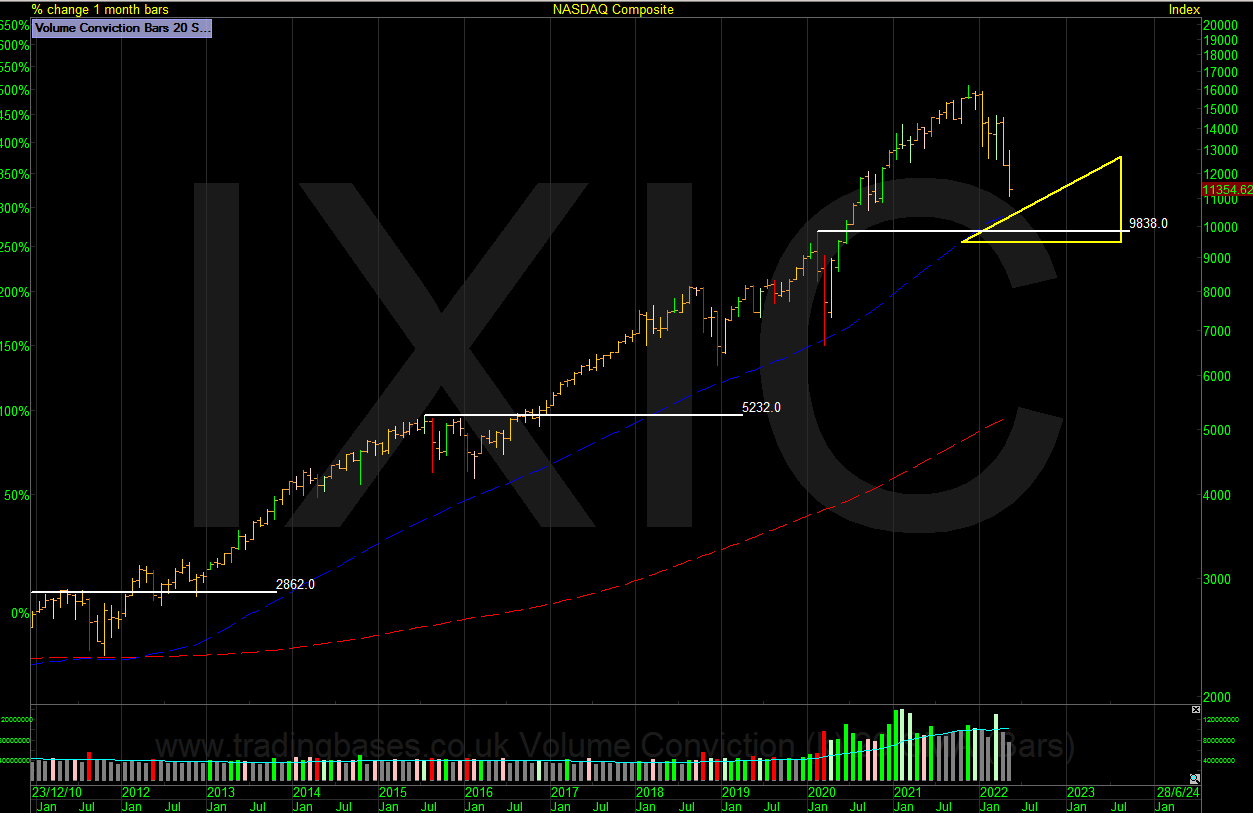
The charts below have the 50-month moving average in blue and the 200-month moving average in red. These are the big guns. We roll out the big guns when we are clearly in a down-trending market to look for meaningful areas where the big players will start to step in. The yellow triangle is a zone built from horizontal support being the previous resistance turning current support and the dynamic support being the big gun moving average. This is my zone of interest.
DJT Transports
DJI Dow Jones
S&P 500
IXIC NASDAQ Composite
RUSSELL 2000
One Market Does Not Make A Trend
I always want to align with the majority. One market landing on potential support isn’t enough. History has taught me that waiting on the strongest market to come into the support zone is more robust. It’s usually the S&P or NASDAQ and small caps usually go to lower support and that could mean the 200 month but it’s certainly not set in stone. We could see markets hold current levels first then rally and still visit deeper levels later.
FTSE All-World Ex US INDEX
TLT 2
0 Year is sat on the 200 Month.
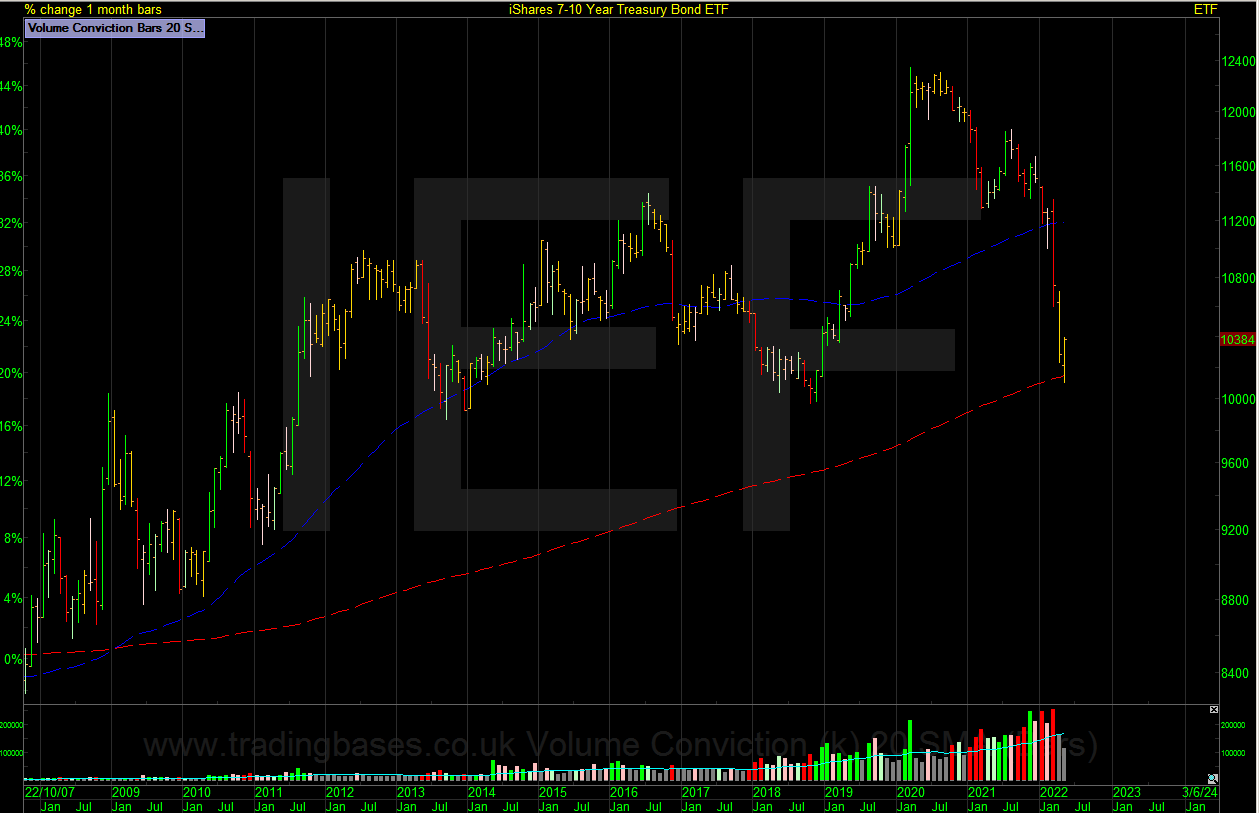
IEF 7-10 Year is sat on the 200 Month
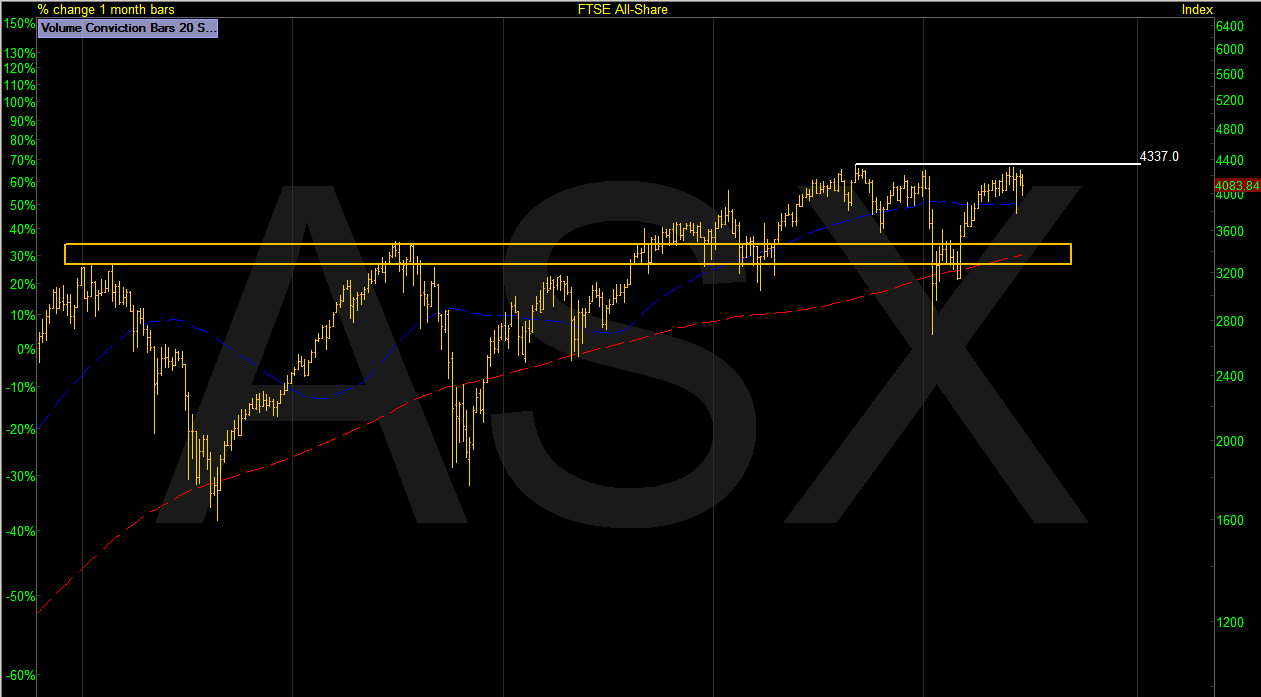
ASX – FTSE All-Share bucking the trend and looking strong.
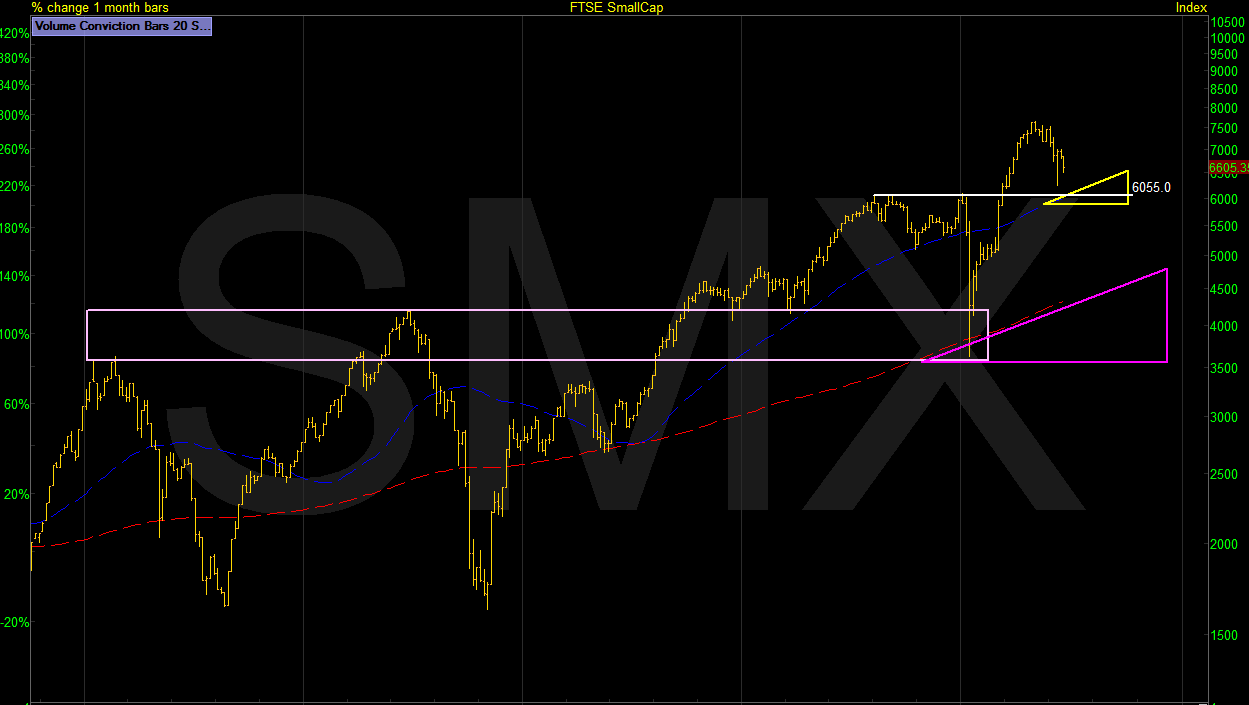
SMX FTSE Smallcap
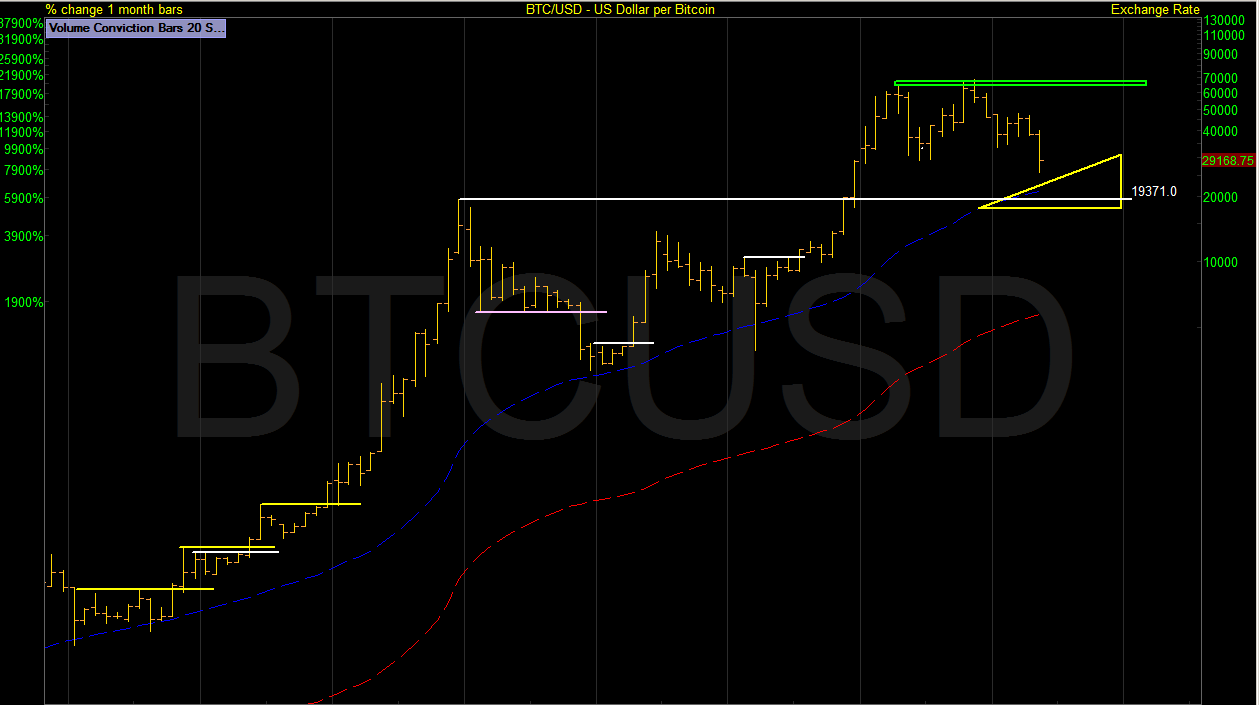
BTC/USD Bitcoin
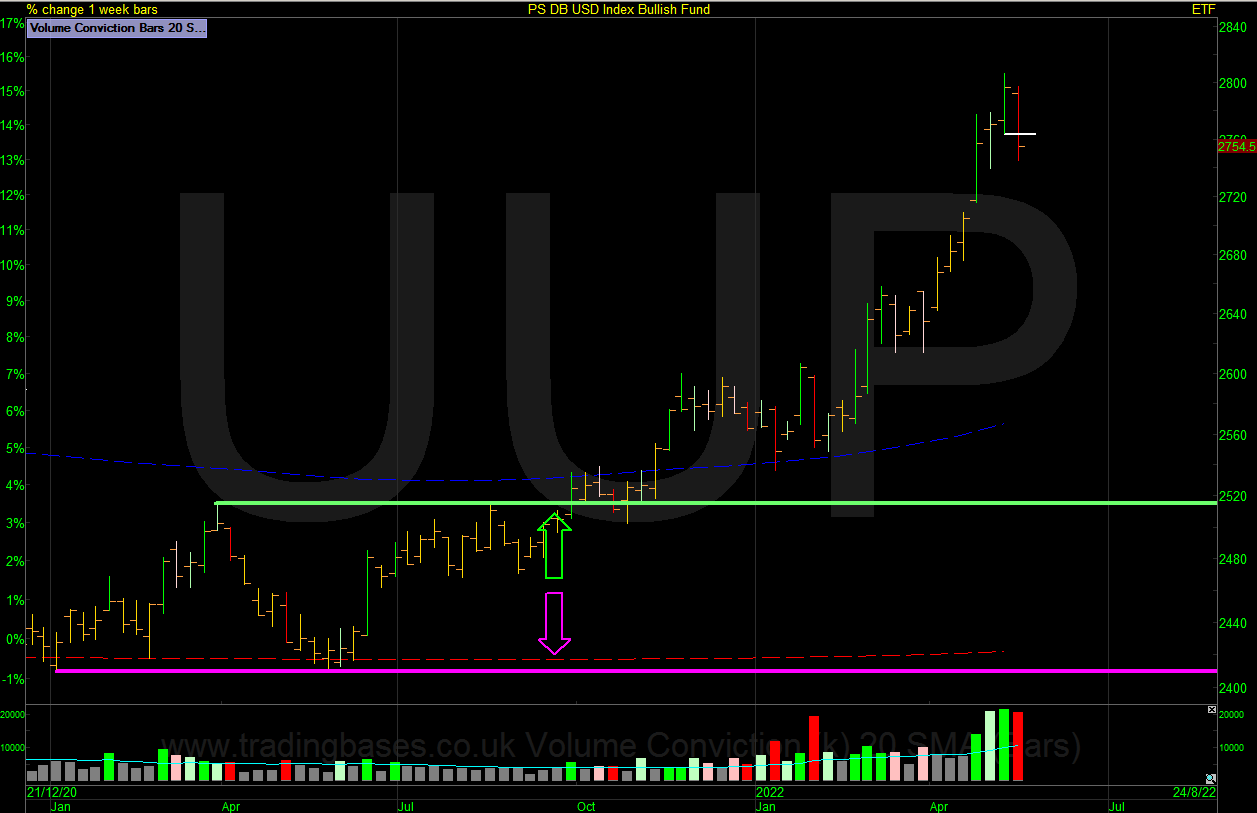
UUP – USD Index. This is a weekly chart and could be due a rest.
This big picture monthly rundown always helps me zoom out of the noise and focus on what we are really looking at. As you will see many correlations are questionable and we have some possible inflection points to focus on right now. I think we are in for an interesting period but for the simple trend follower like myself, I will continue to be aware of these big market levels but focus on what is setting up at the right-hand edge for clues on leadership going forward.
Jason Needham | Twitter: @stealthsurf
Got some thoughts on this latest article from Jason? Share these in the SharePad “Traders’ chat”. Login to SharePad – click on the chat icon in the top right – select or search for “Traders’ chat” chat.
This article is for educational purposes only. It is not a recommendation to buy or sell shares or other investments. Do your own research before buying or selling any investment or seek professional financial advice.


