

William, one of our youngest SharePad subscribers, gives us an update on his A level preparation and his latest swing trades using point and figure charts. Read his previous articles here.
It’s been a very busy start to the New Year with my A Level mocks, along with lots of studying ready for the Summer A levels.
I have been working on some new share trades and looking after existing trades.
There have been quite a few opportunities for swing trading on my point and figure charts over the past couple of months. I have tried to trade as many of them as my limited funds would allow. Also, the great thing about swing trading is how much I can learn from each trade. It is excellent practice for me. It’s helping me to test my techniques on point and figure charts (you can read more about how to use these in SharePad in this tutorial).
SHARES BOUGHT/SOLD/HELD
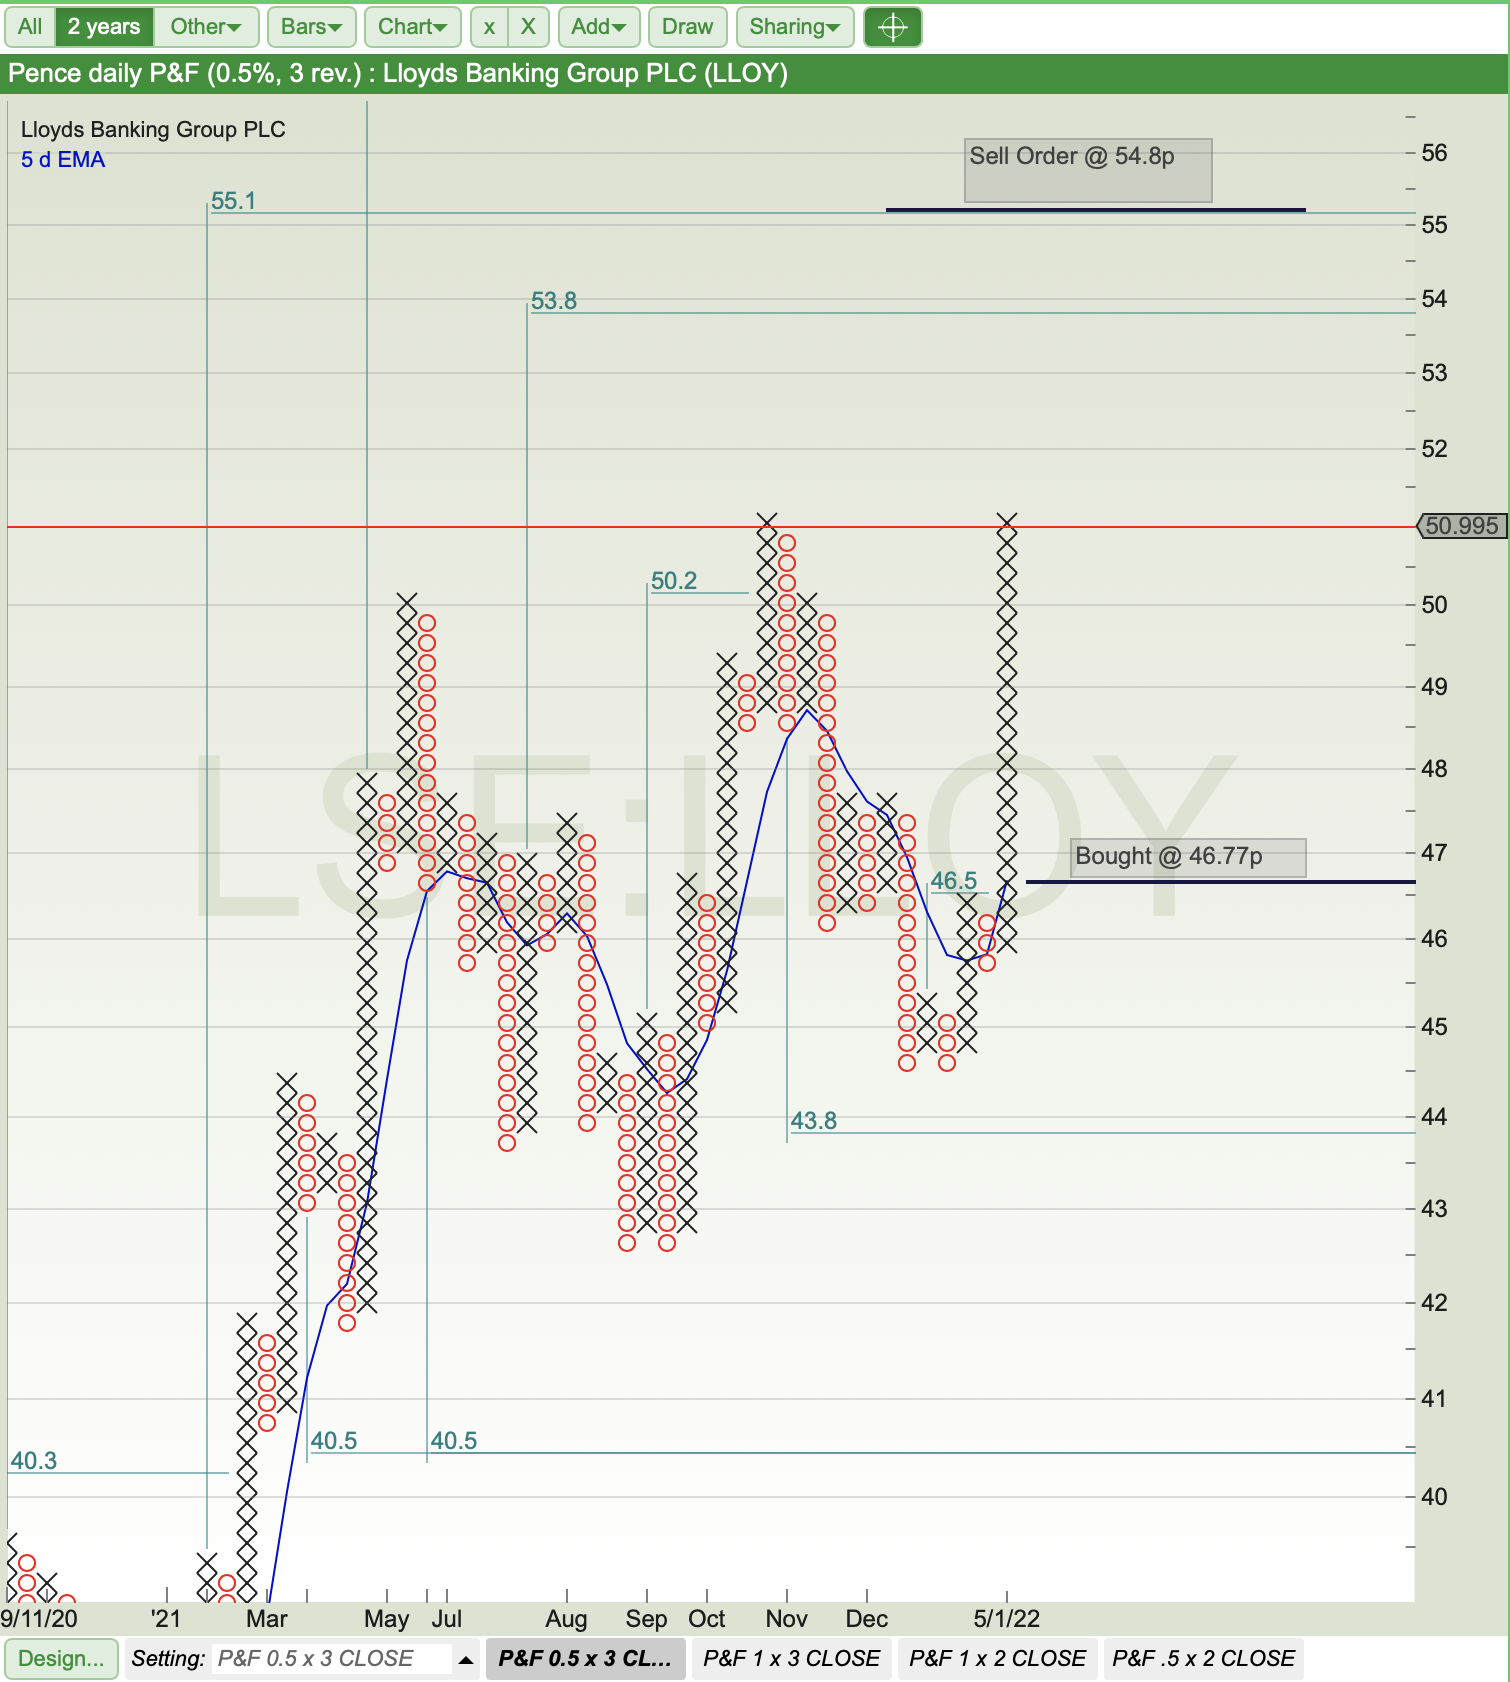
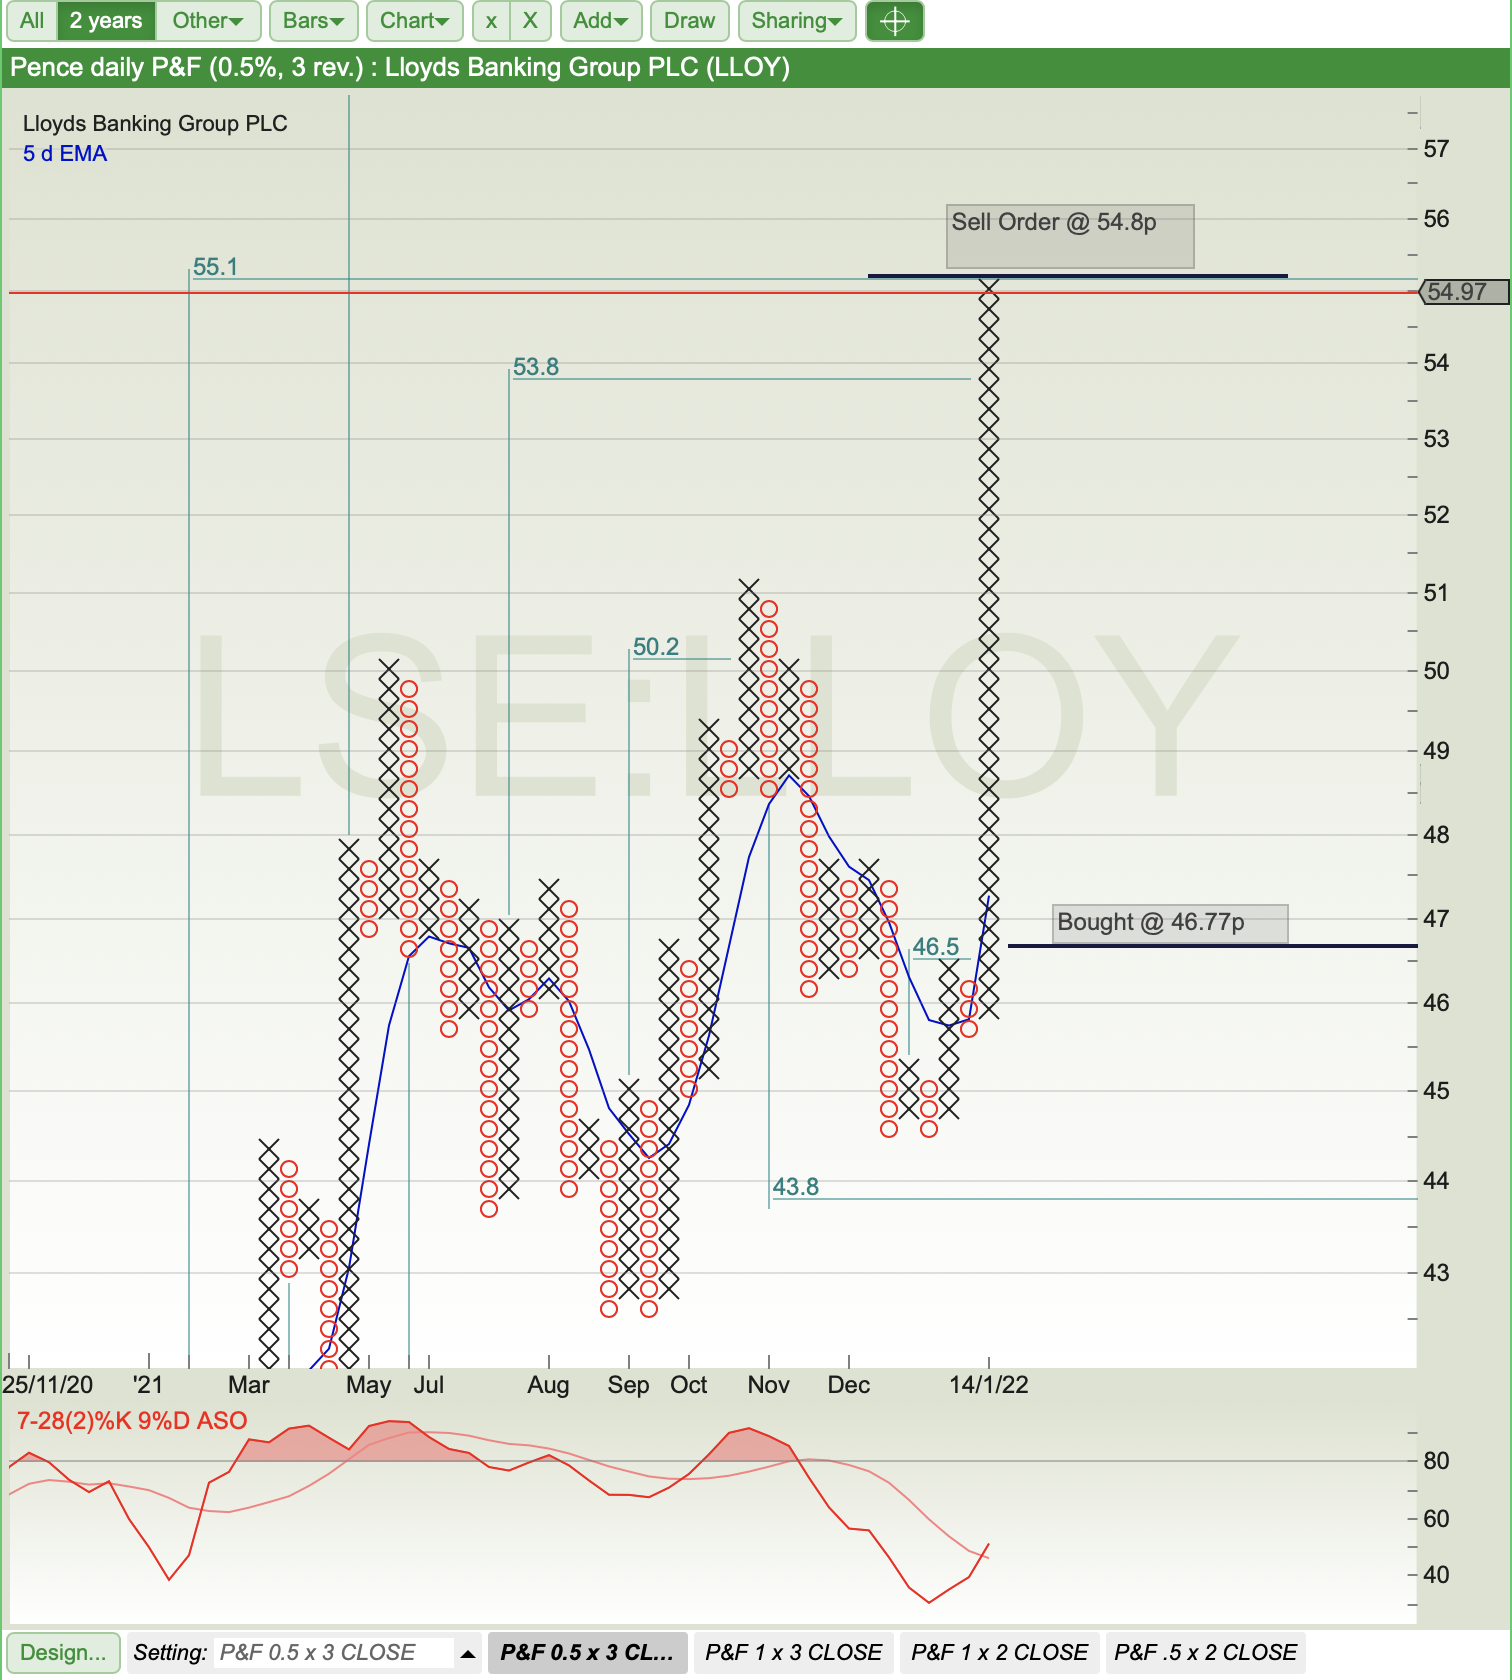
LLOYDS – LLOY
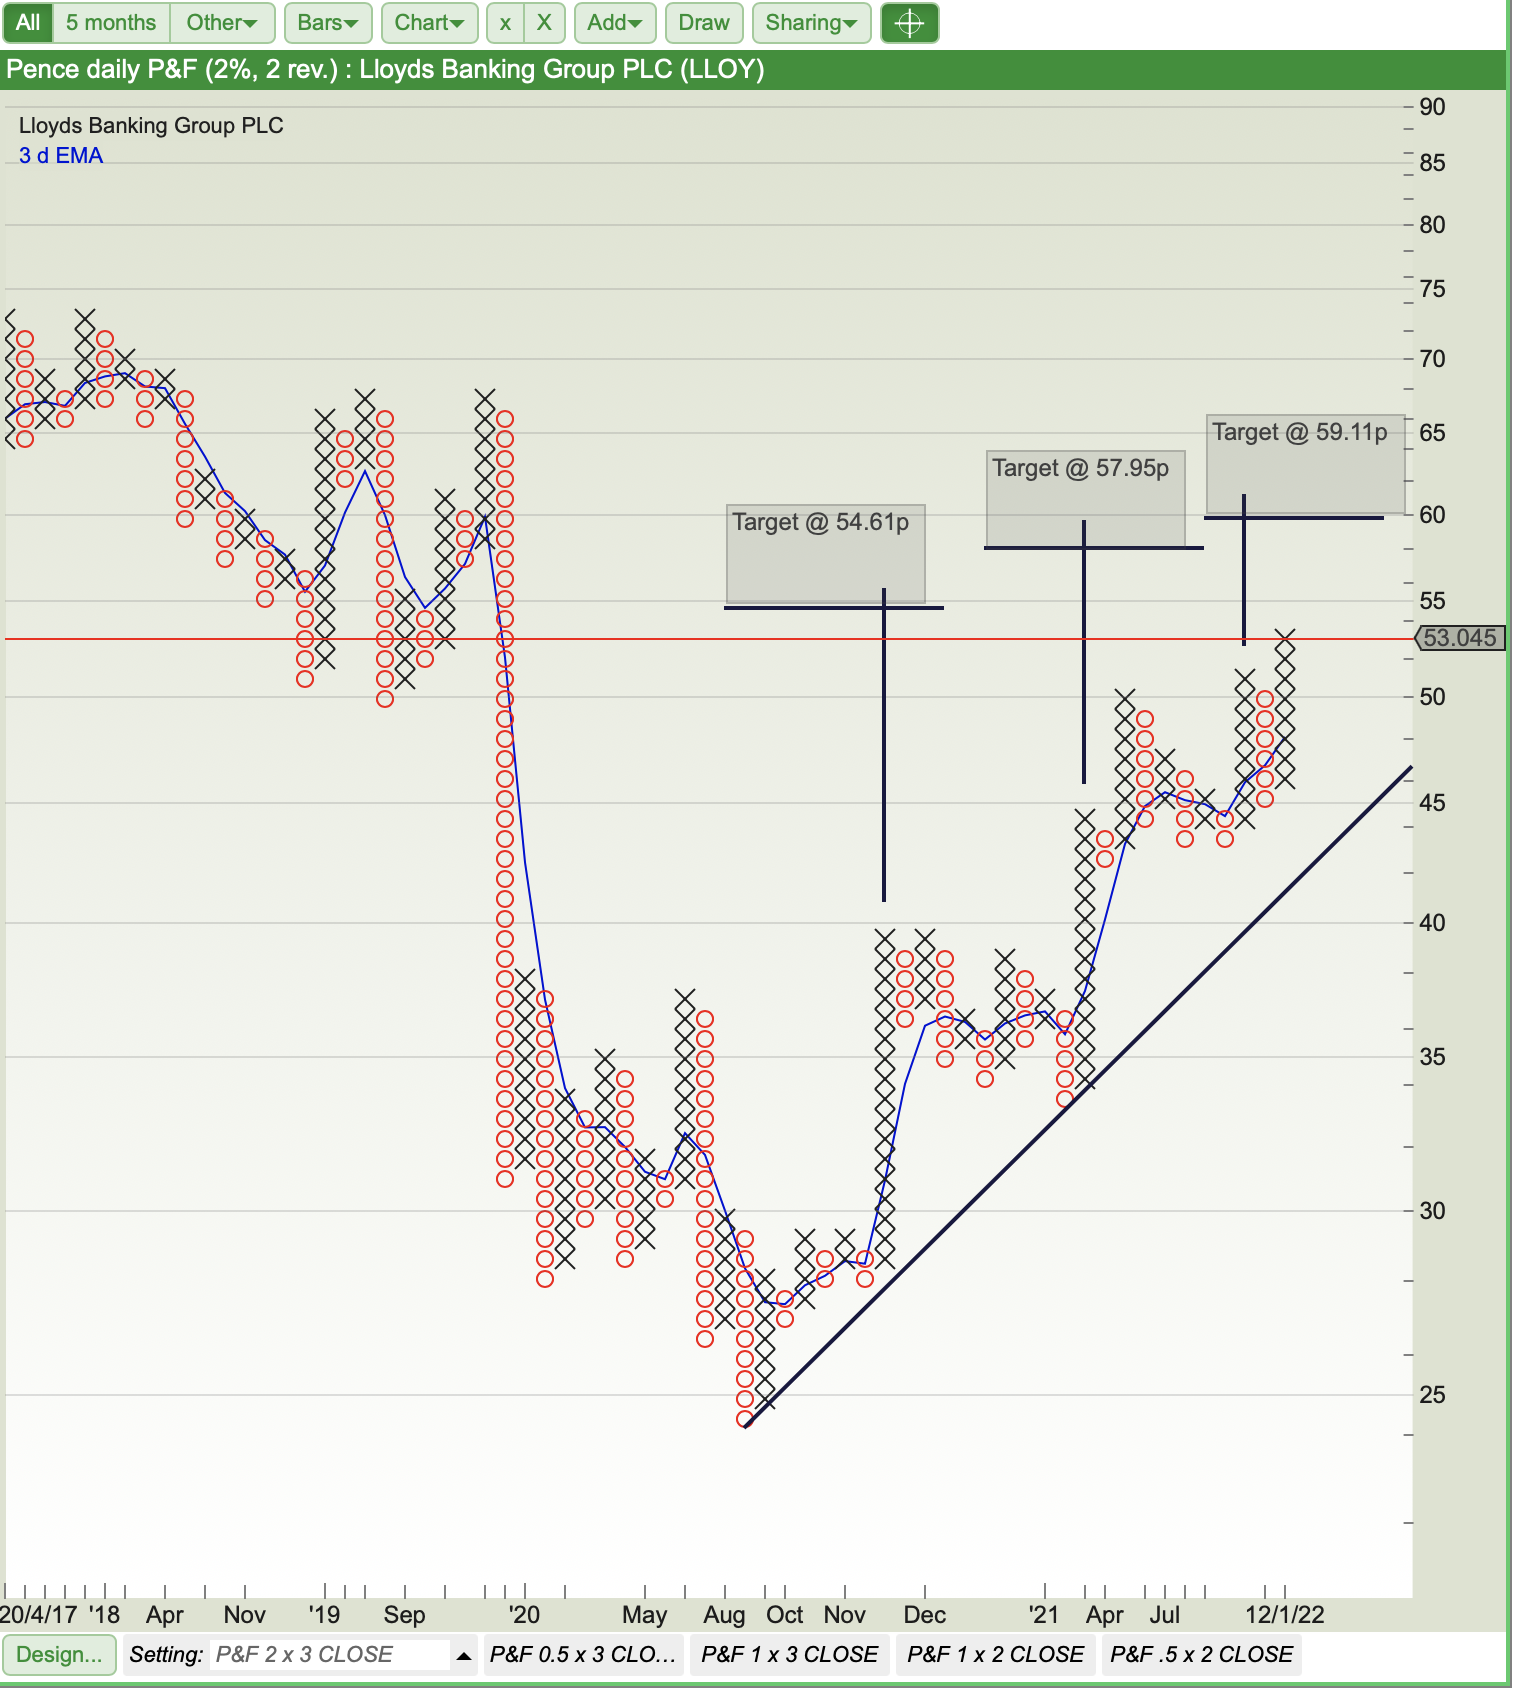
I bought Lloyds on the 22nd of December at 46.77p as a swing trade at the start of a buy pattern. The share was bullish on the 0.5% x 3, 1% x 3 and longer term 2% x 2 close chart, with multiple upward targets.
Multiple upward targets on the 2% x 2 Close chart.
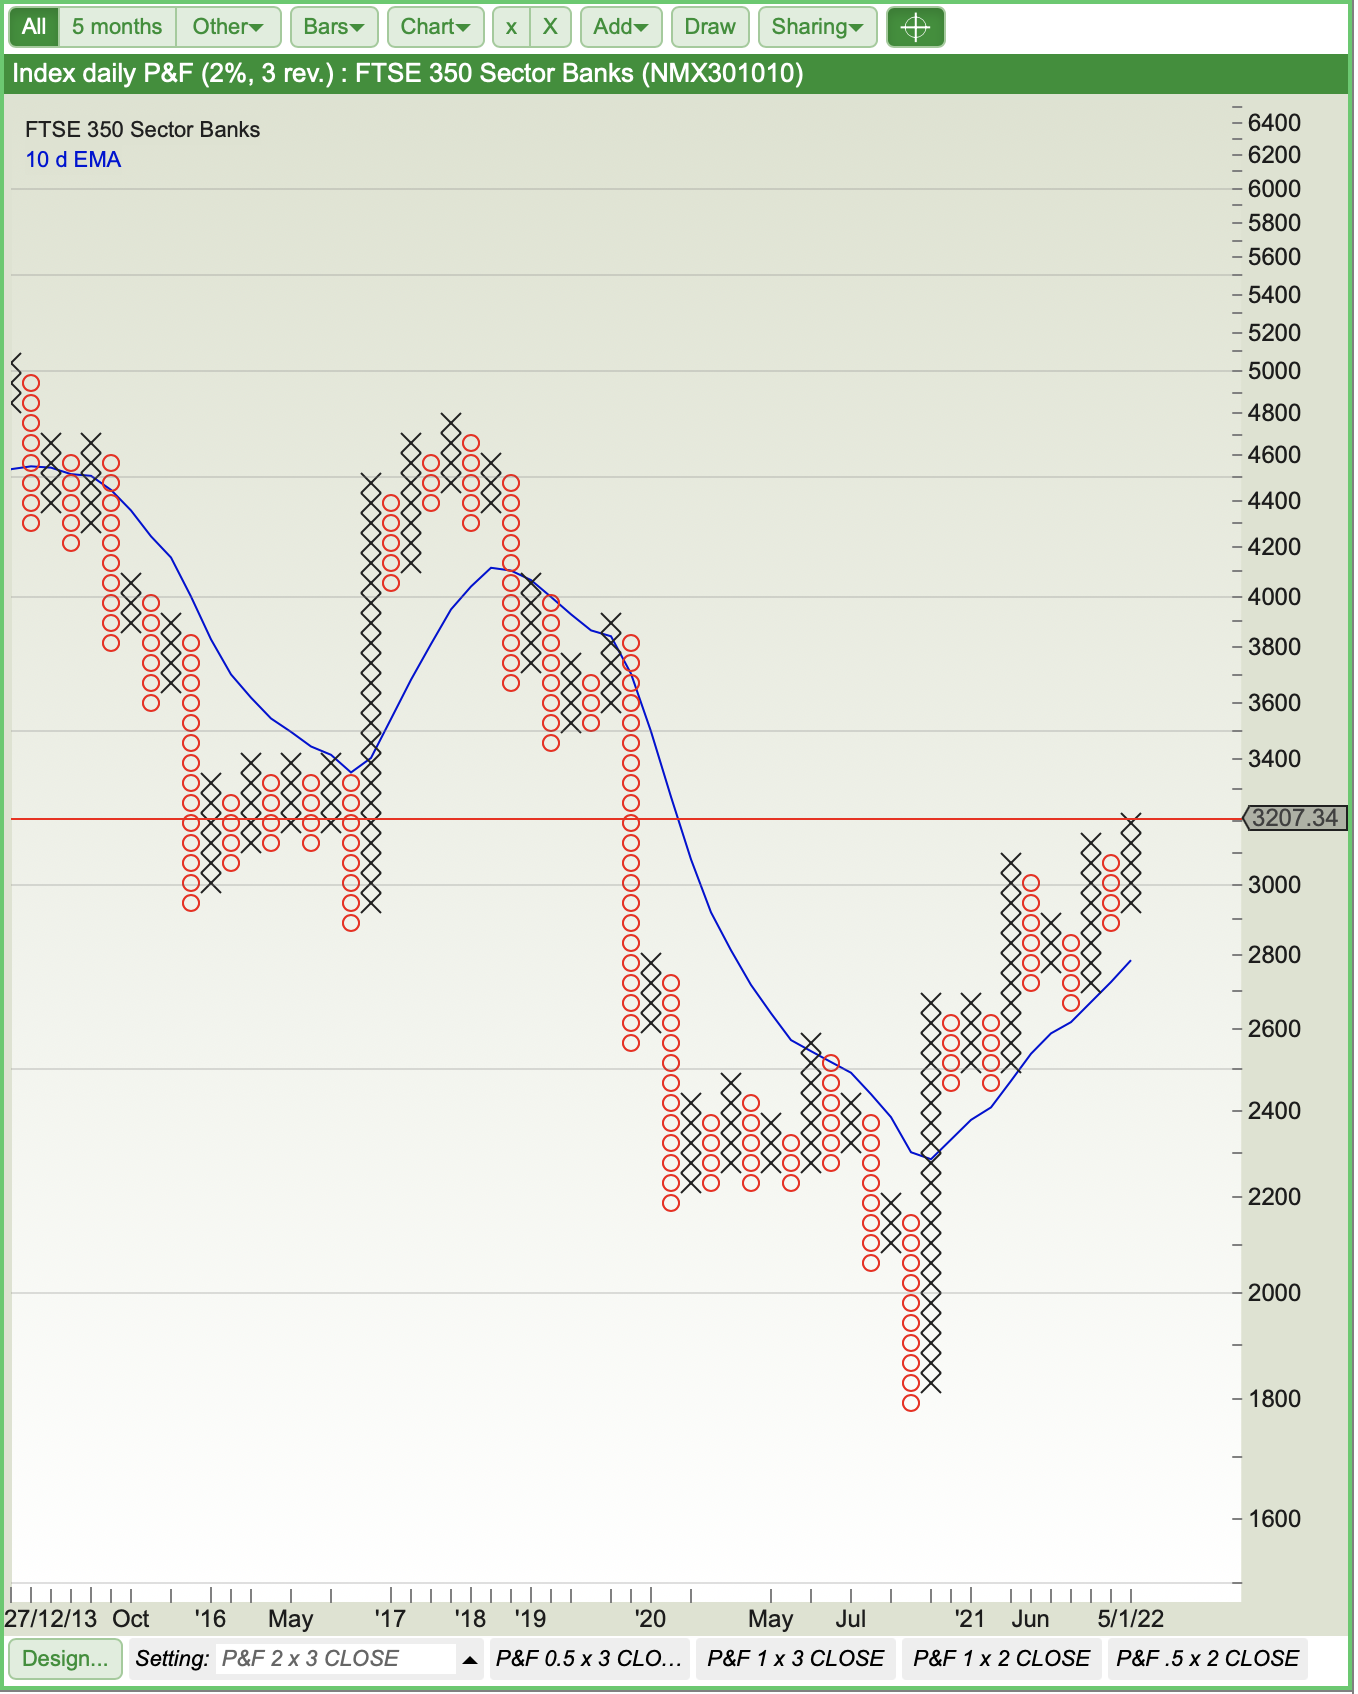
I checked the banking sector 2% x 3 close chart which was looking very positive.
I set my sell order at just under a target from the 0.5% x 3 close chart at a price of 54.8p.
The risk/reward for this trade was as follows:
Count target: 54.8p
Reward: Count target (54.8p) – buy price (46.77p) = 8.03p
Risk: Buy price (46.77p) – stop price (45.18p) = 1.59p
Risk/reward: Reward (8.03p)/risk (1.59p) = 5:1
I usually look for a risk/reward minimum of 3:1. This trade at 5:1 was very good.
The price target was met on the 14th of Jan 22 and the share sold at 54.8p.
CLOSE BROTHERS GROUP – CBG
Close Brothers is a share I had been watching for a while to buy as a swing trade when a buying pattern formed.
This was bought on the 23rd of December at 1363p from the 0.5% x 3 close chart. It had an upward target of 1460p and I set my sell order at 1458p. The risk/reward was 2. 6:1, which was a bit low as I prefer to buy at a minimum of 3:1 ratio. But, as I saw this as a quick swing trade, I gave it a go.
I had already checked out the banking sector when I was analysing Lloyds. The 2% x 3 close sector chart was on a buy pattern and was in a column of X’s when I purchased CBG.
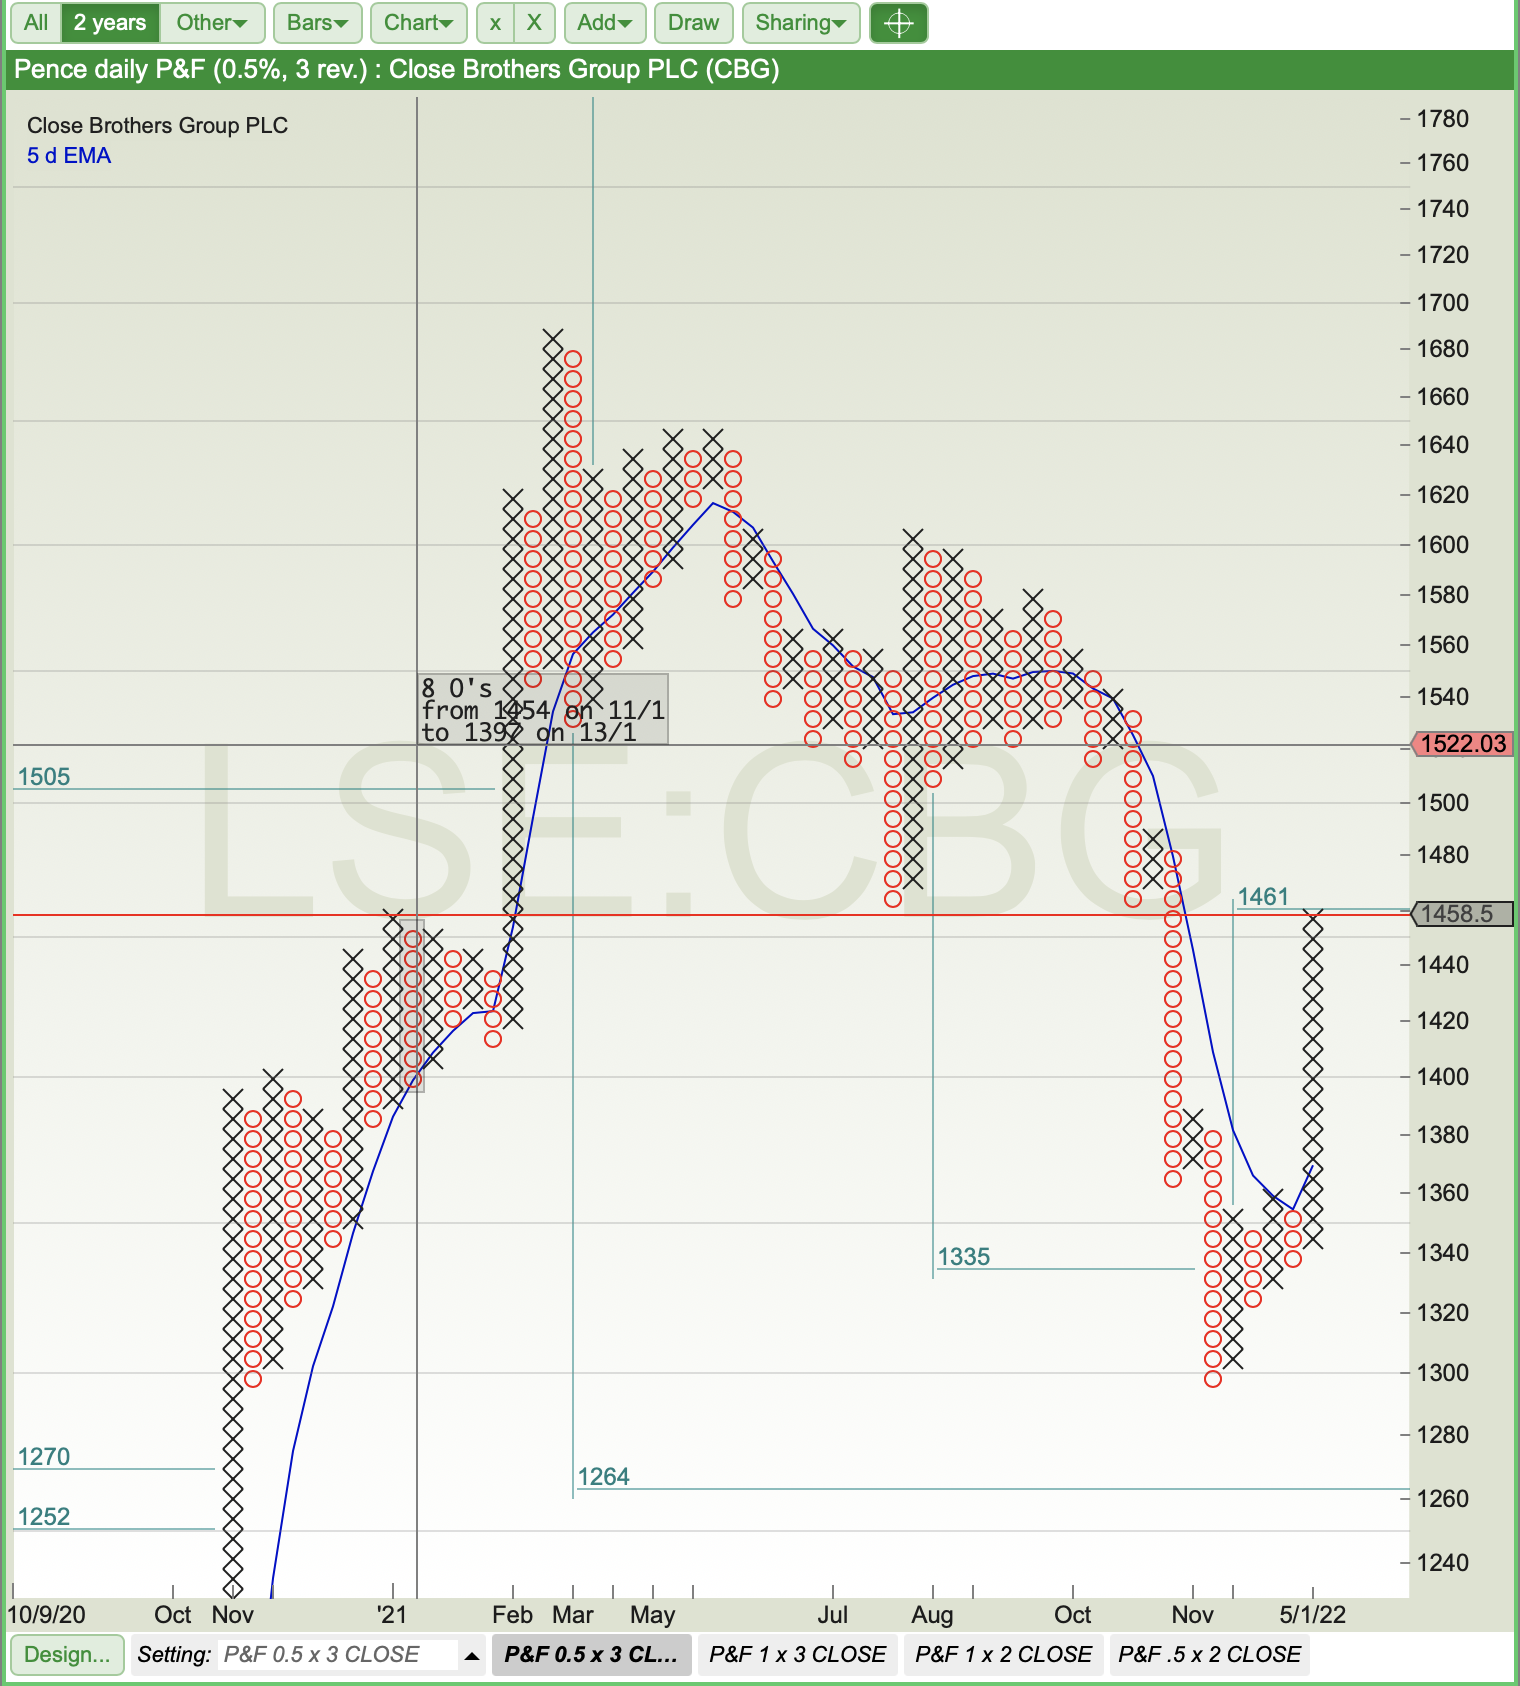
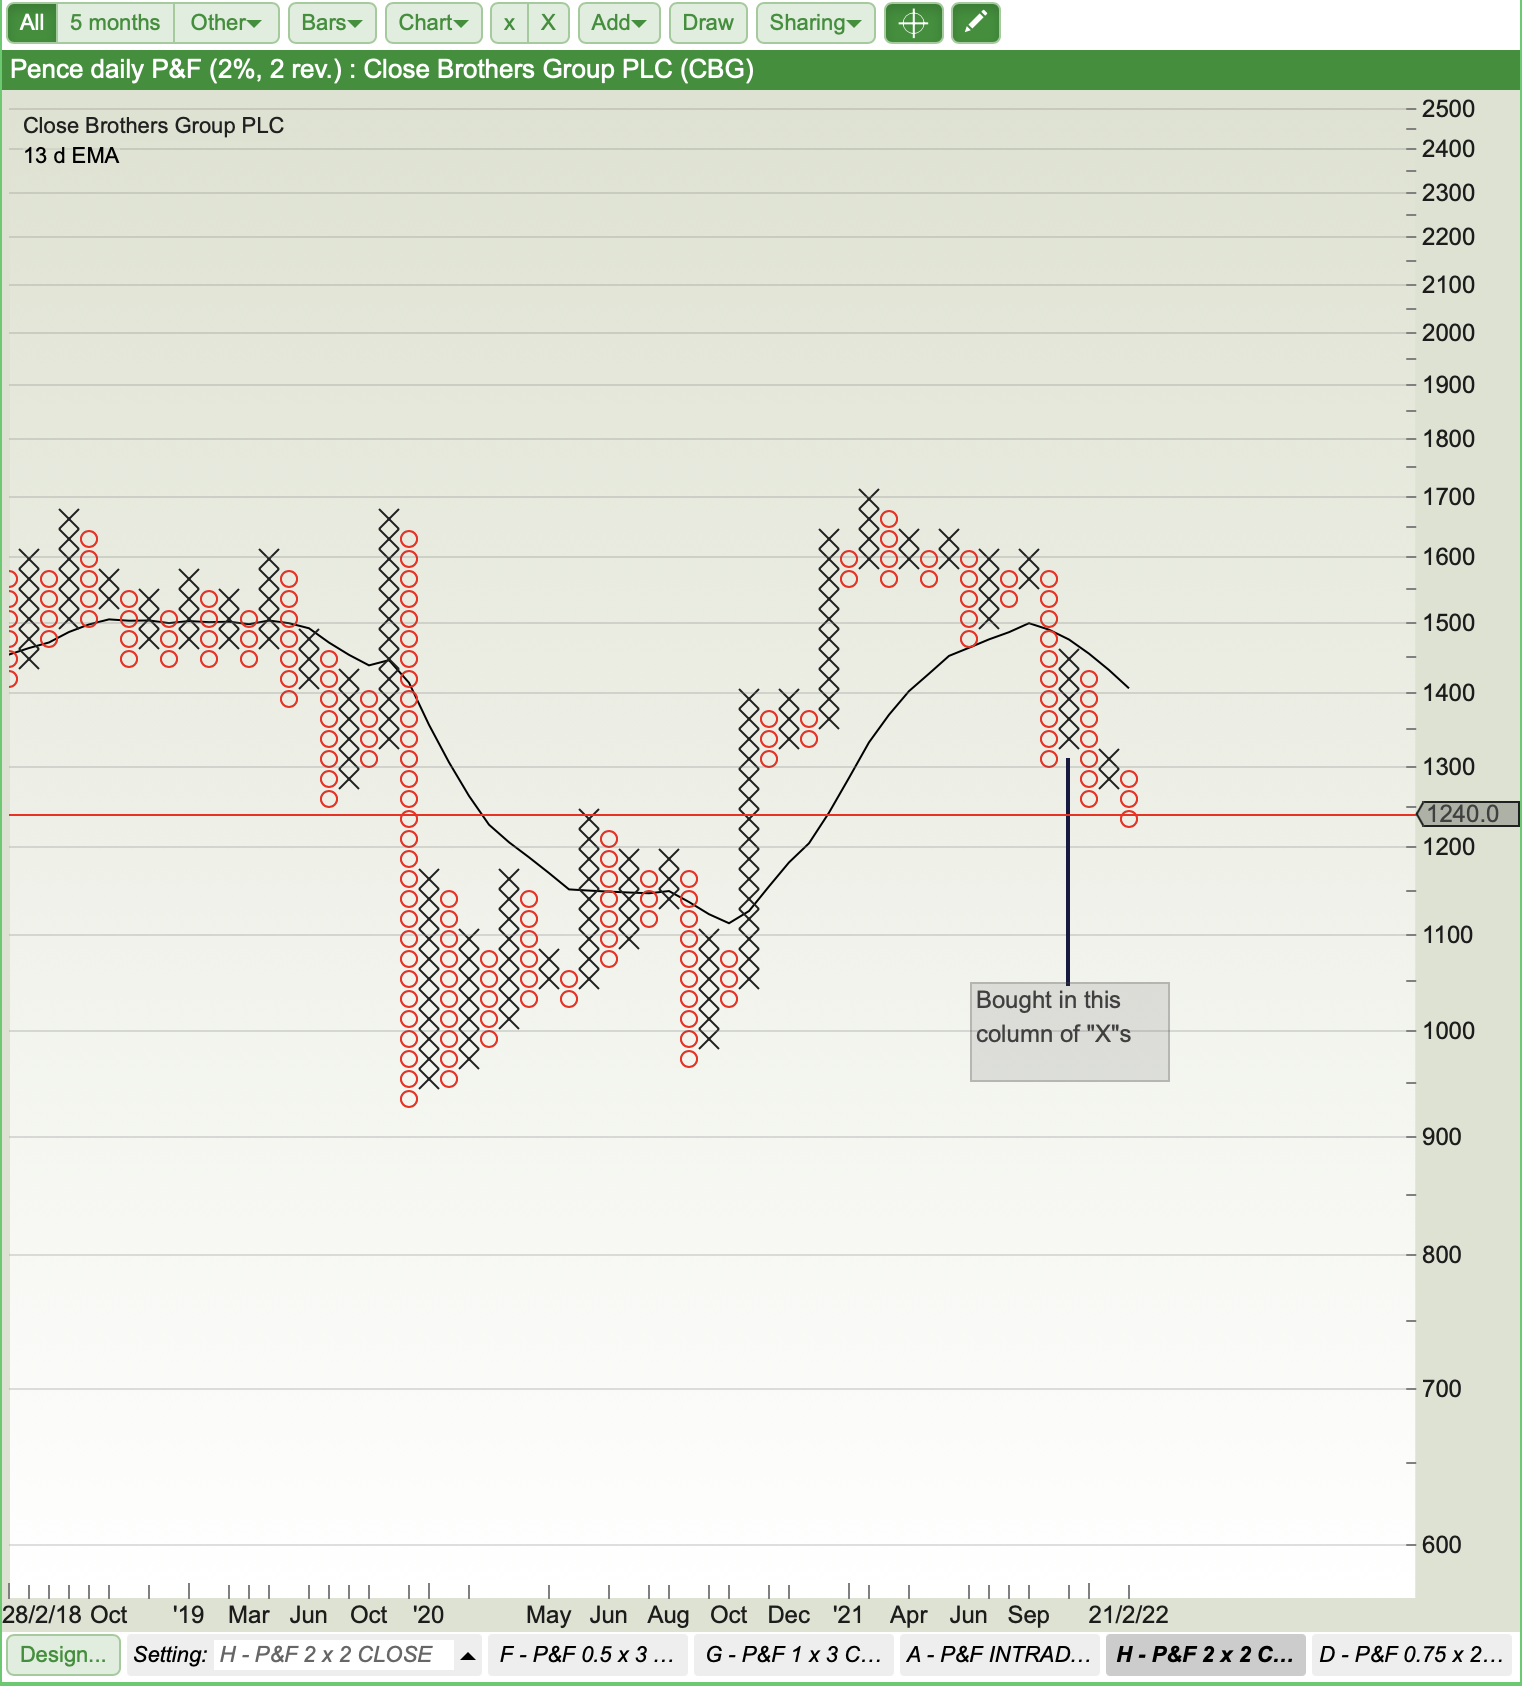
The 2% x 2 close chart, which I like to use for a longer perspective, showed the share was weak as a longer-term buy, so I wanted to get in and out quickly just in case it turned out to be a quick spike – which it was!
CBG was sold on the 5th of Jan when the selling order set at 1458p was filled.
SSE
I bought SSE at 1544p November 21 from the 1% x 3 close chart after a RNS price drop. I had a selling order placed at 1685p but actually sold at 1683p on the 4th of Jan. I will wait to see now if this share breaks through and settles above its 1690p resistance line before looking to buy again. I will also keep a check on it for any significant pull backs as long as it remains overall bullish.
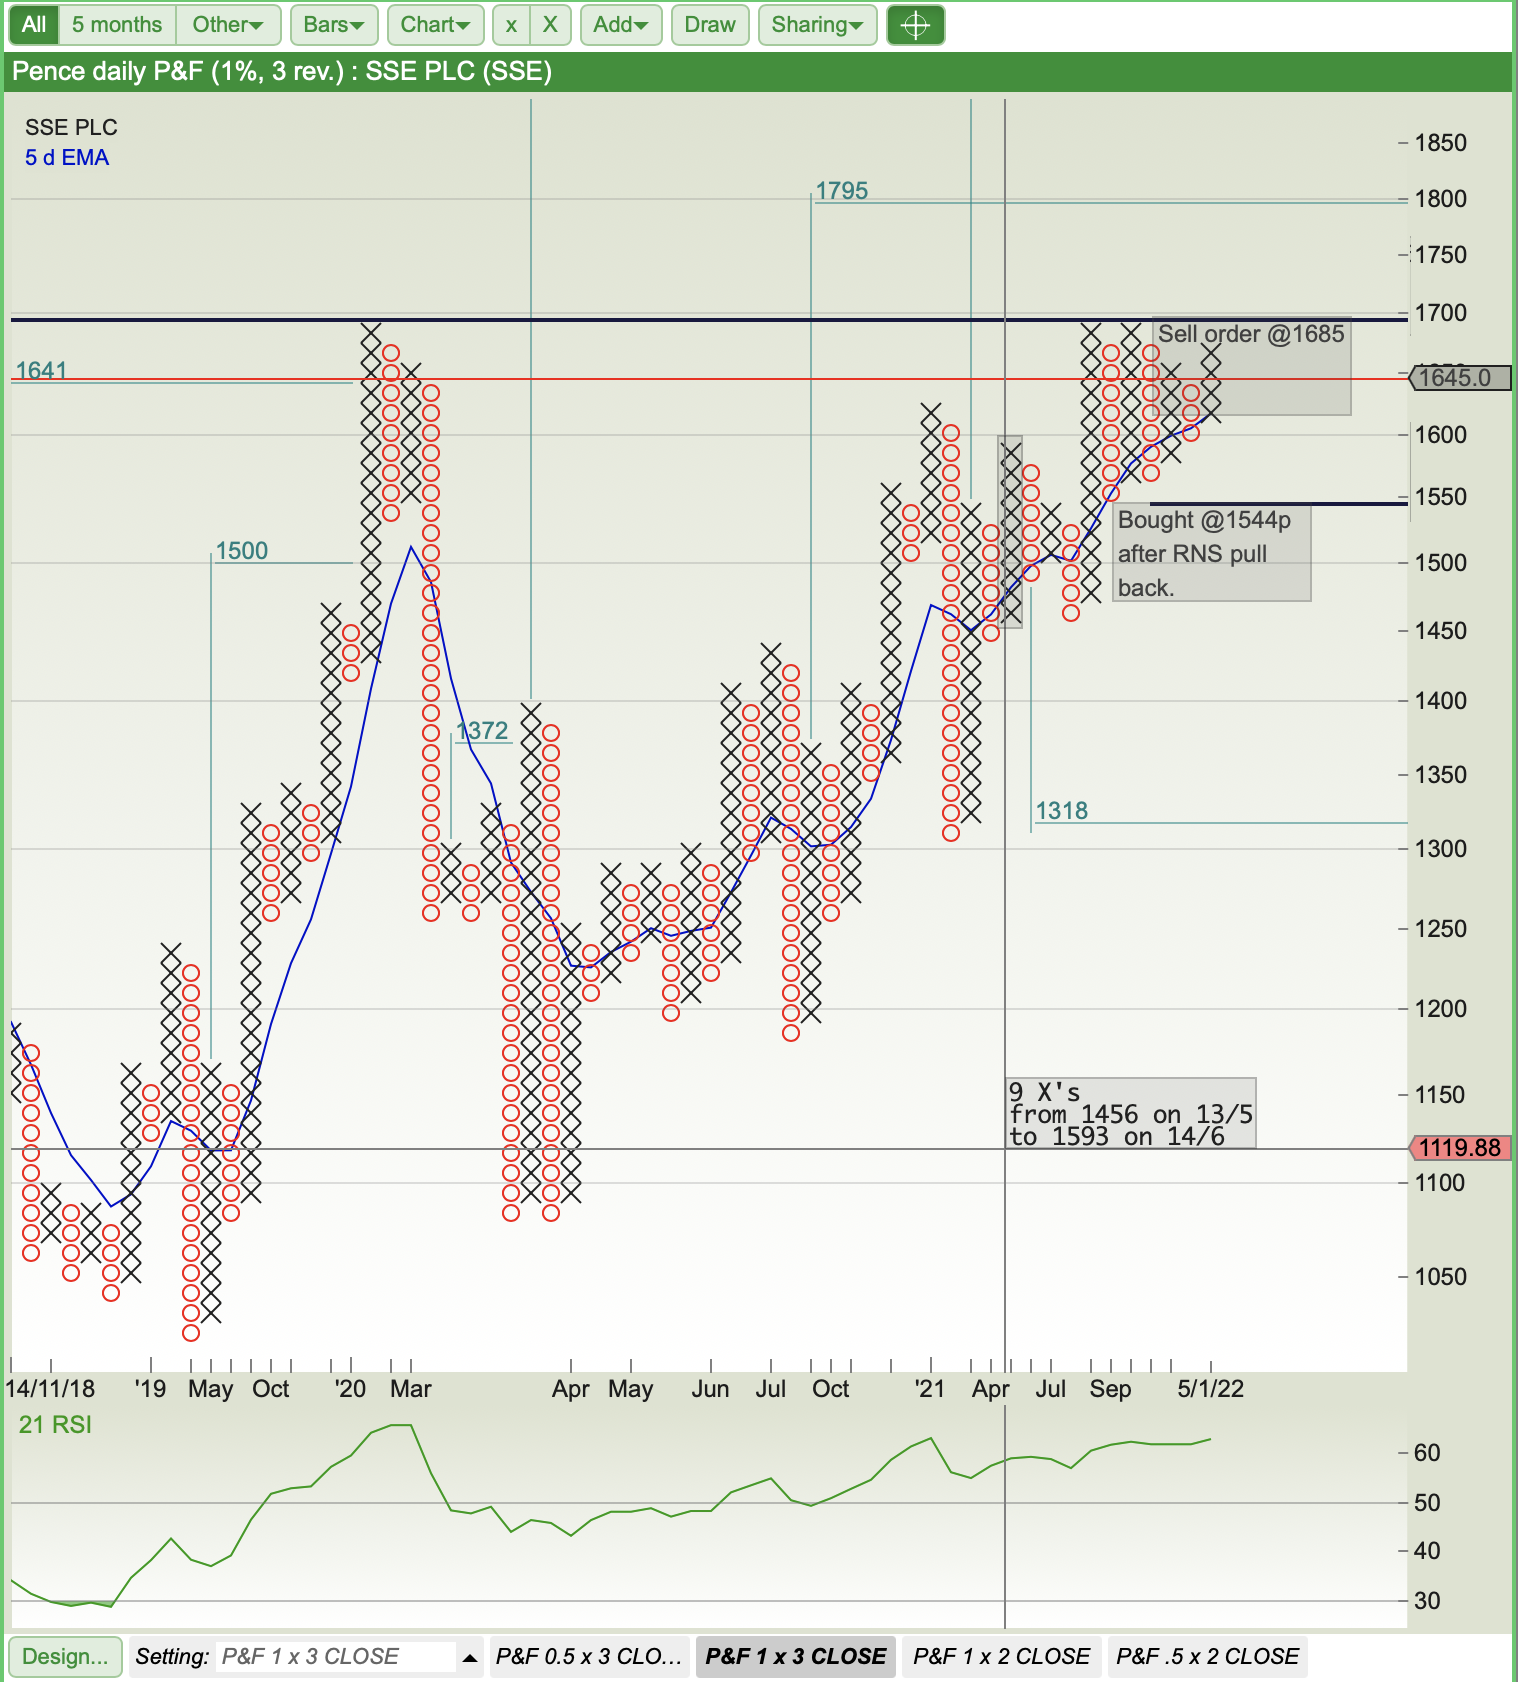
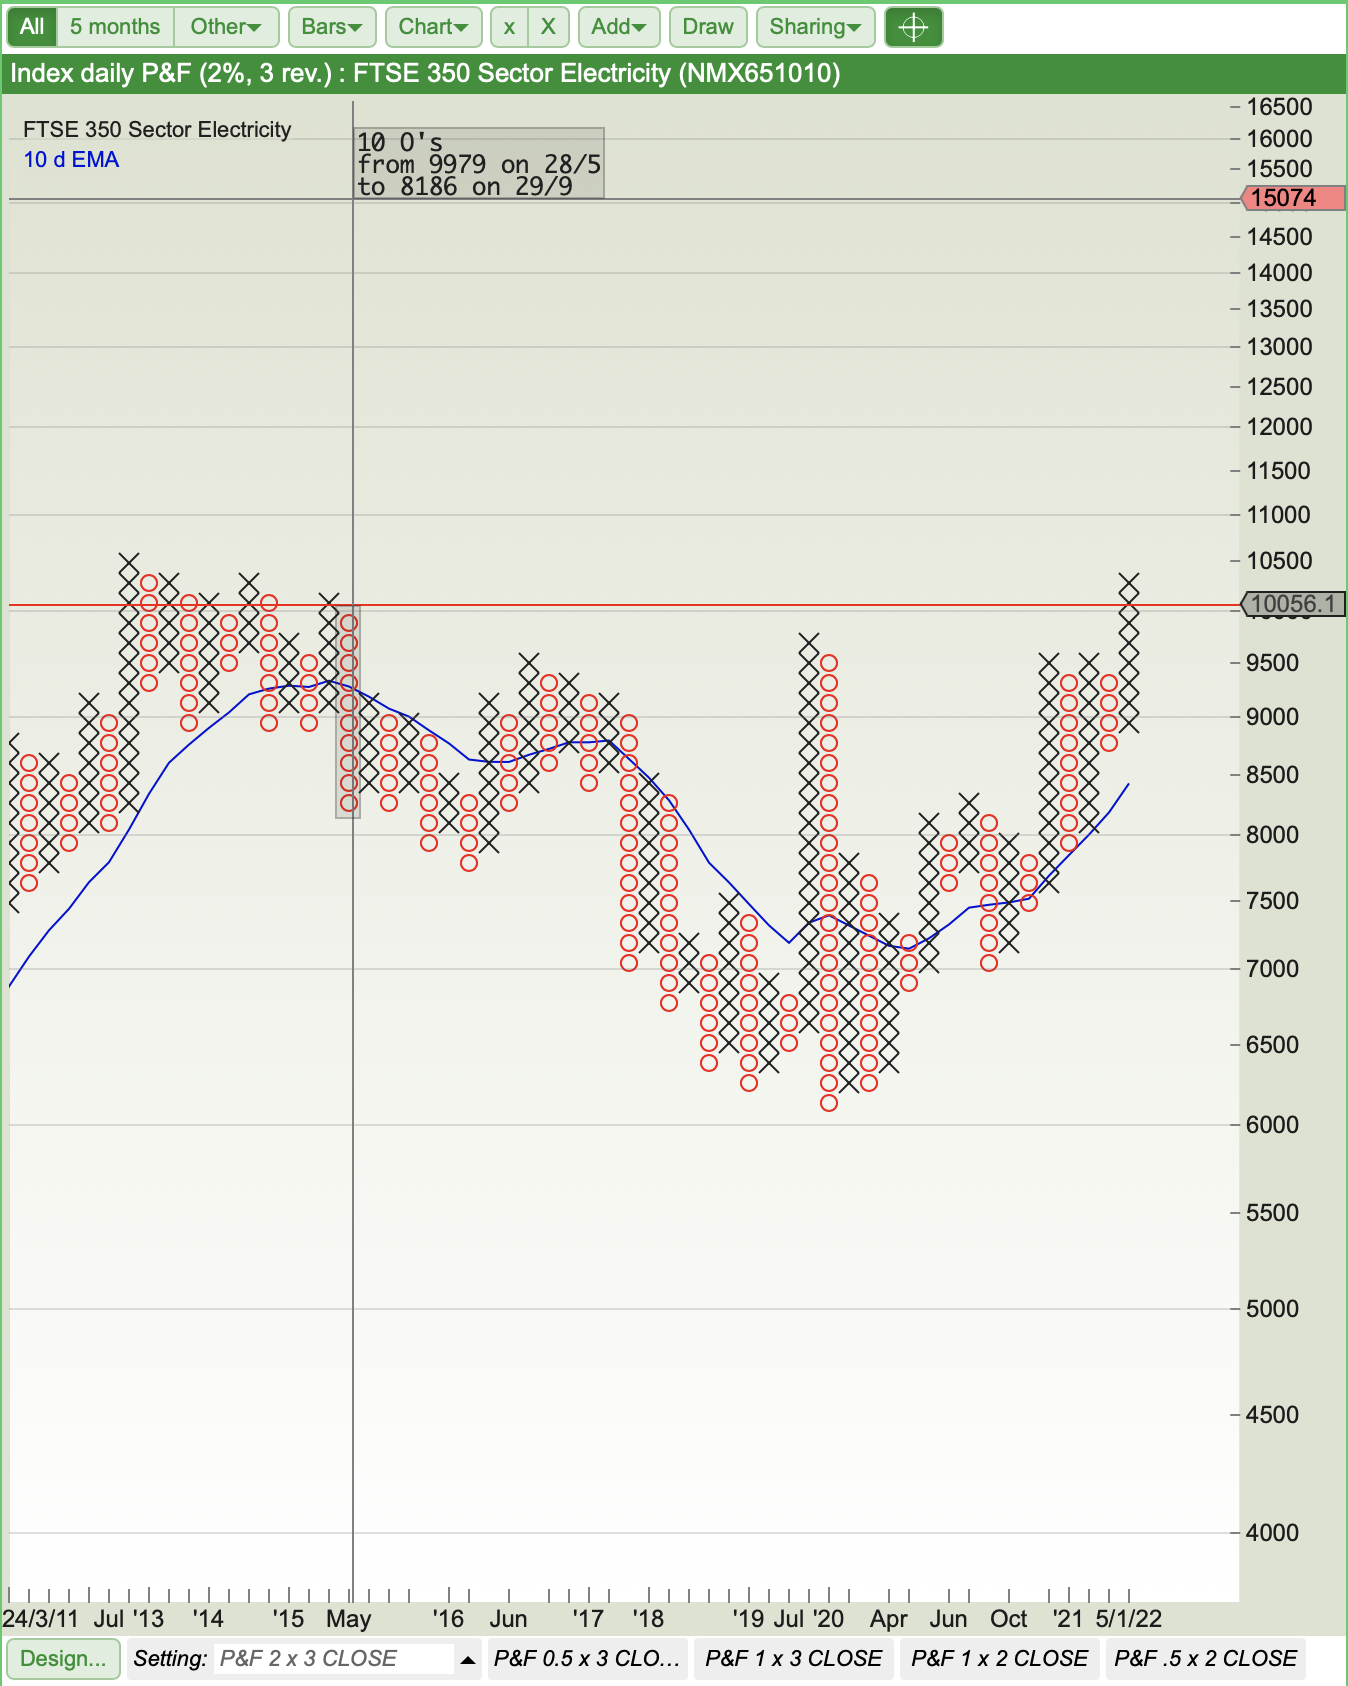
The electricity sector chart (2% x 3 close) had been in a buy pattern since November 20. When I bought SSE the chart was also in a column of X’s.
BAE SYSTEMS – BA.
I previously bought and sold BAE last year. I had been keeping a close eye on the share with a view to buying again on a decent pull back. Well, it pulled back to a support of 533p on the 20th of Dec 21. I checked my 2% x 2 close chart for a longer-term perspective which was showing the share to be bullish with an upward target of 674p.
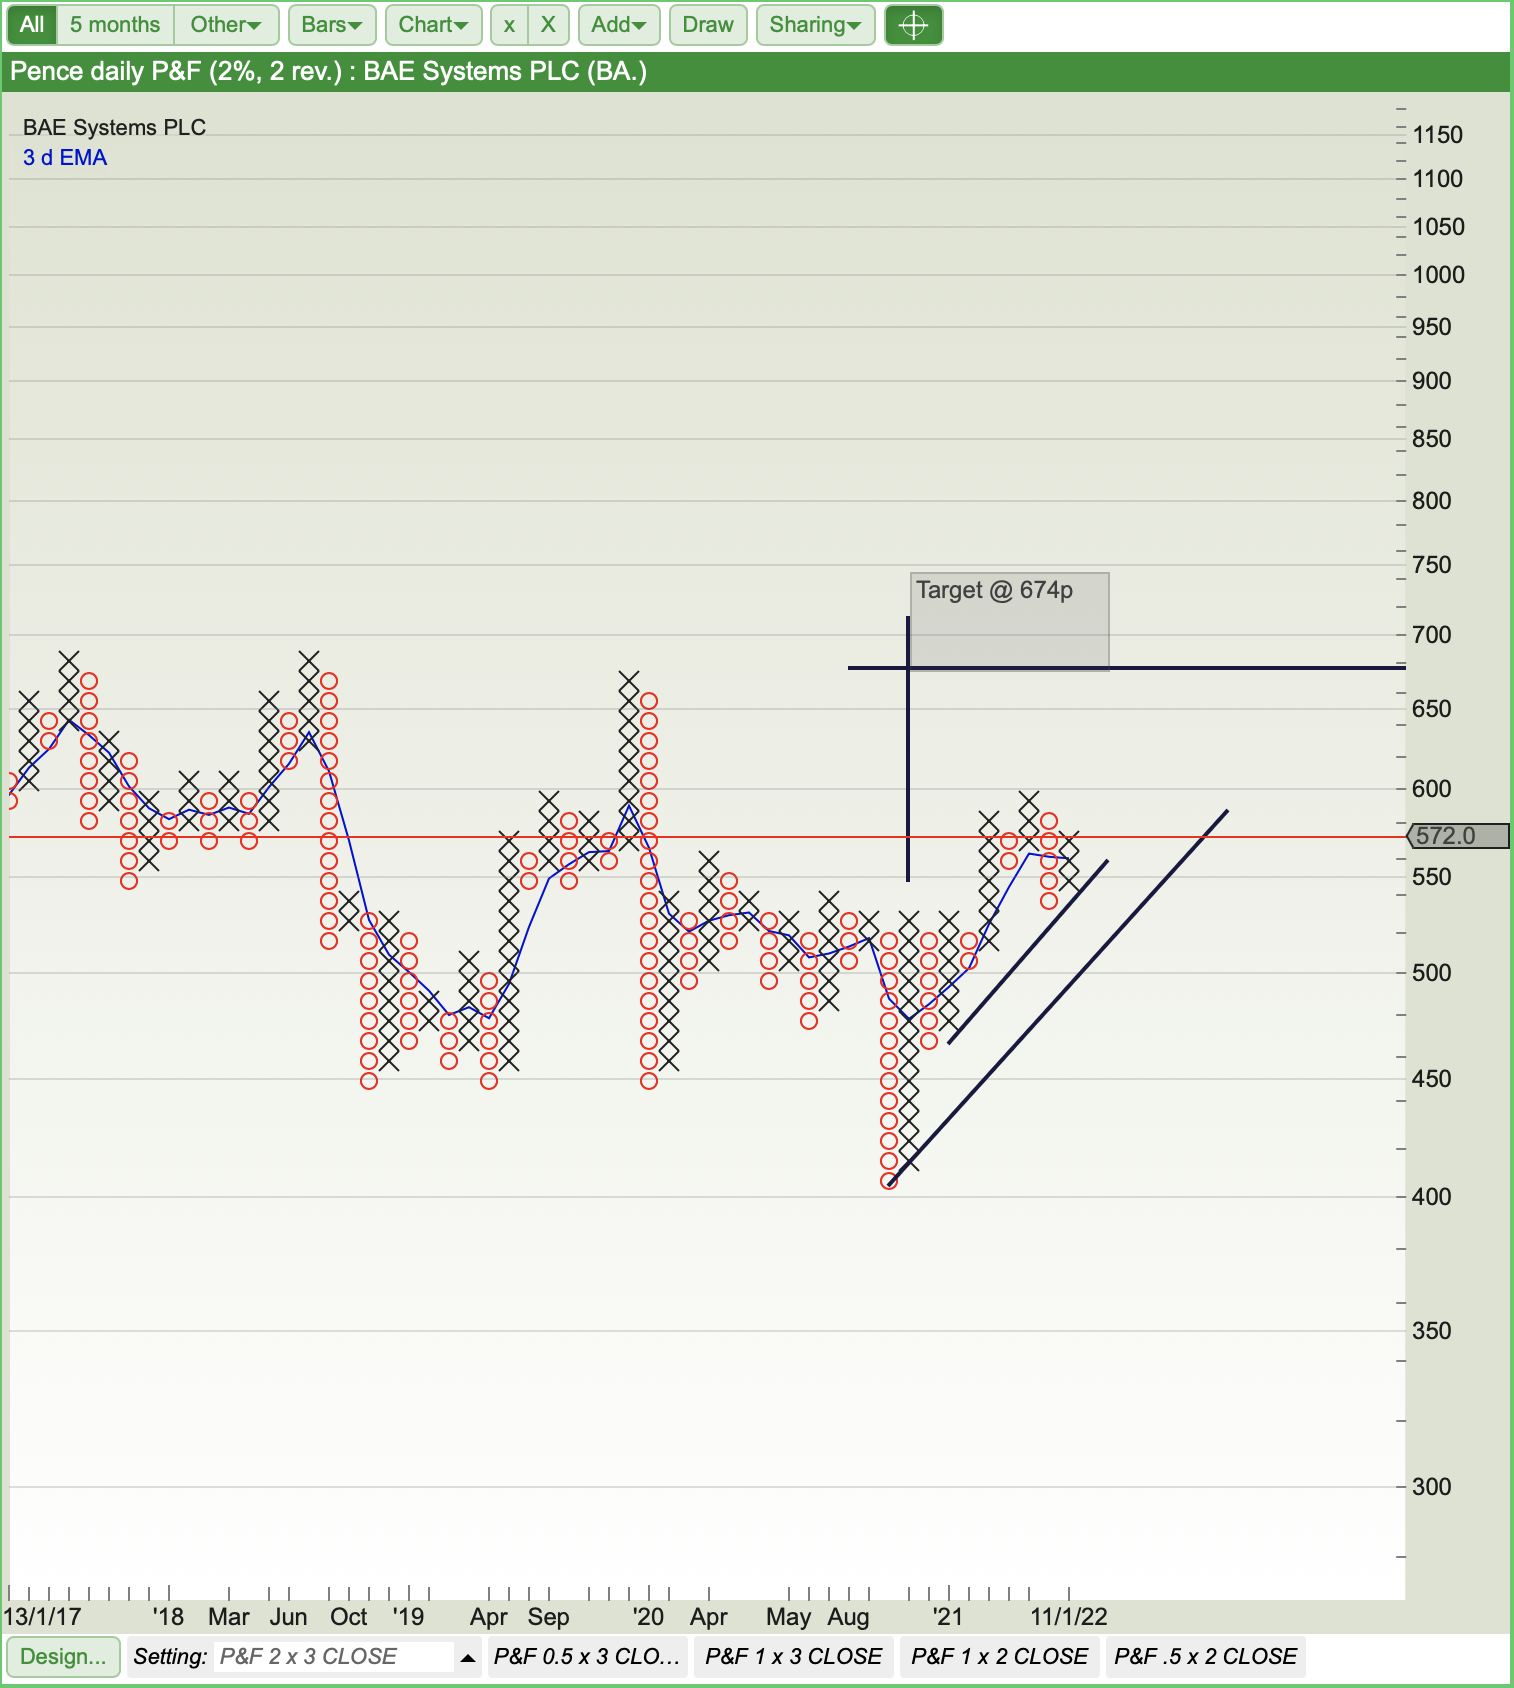
Both the 0.5% x 3 close and 1% x 3 close charts were bullish with an upward target of 650p on the 1% x 3 close. Fundamental forecasts were also still looking good, and fair value based on dividend discount was 523p.
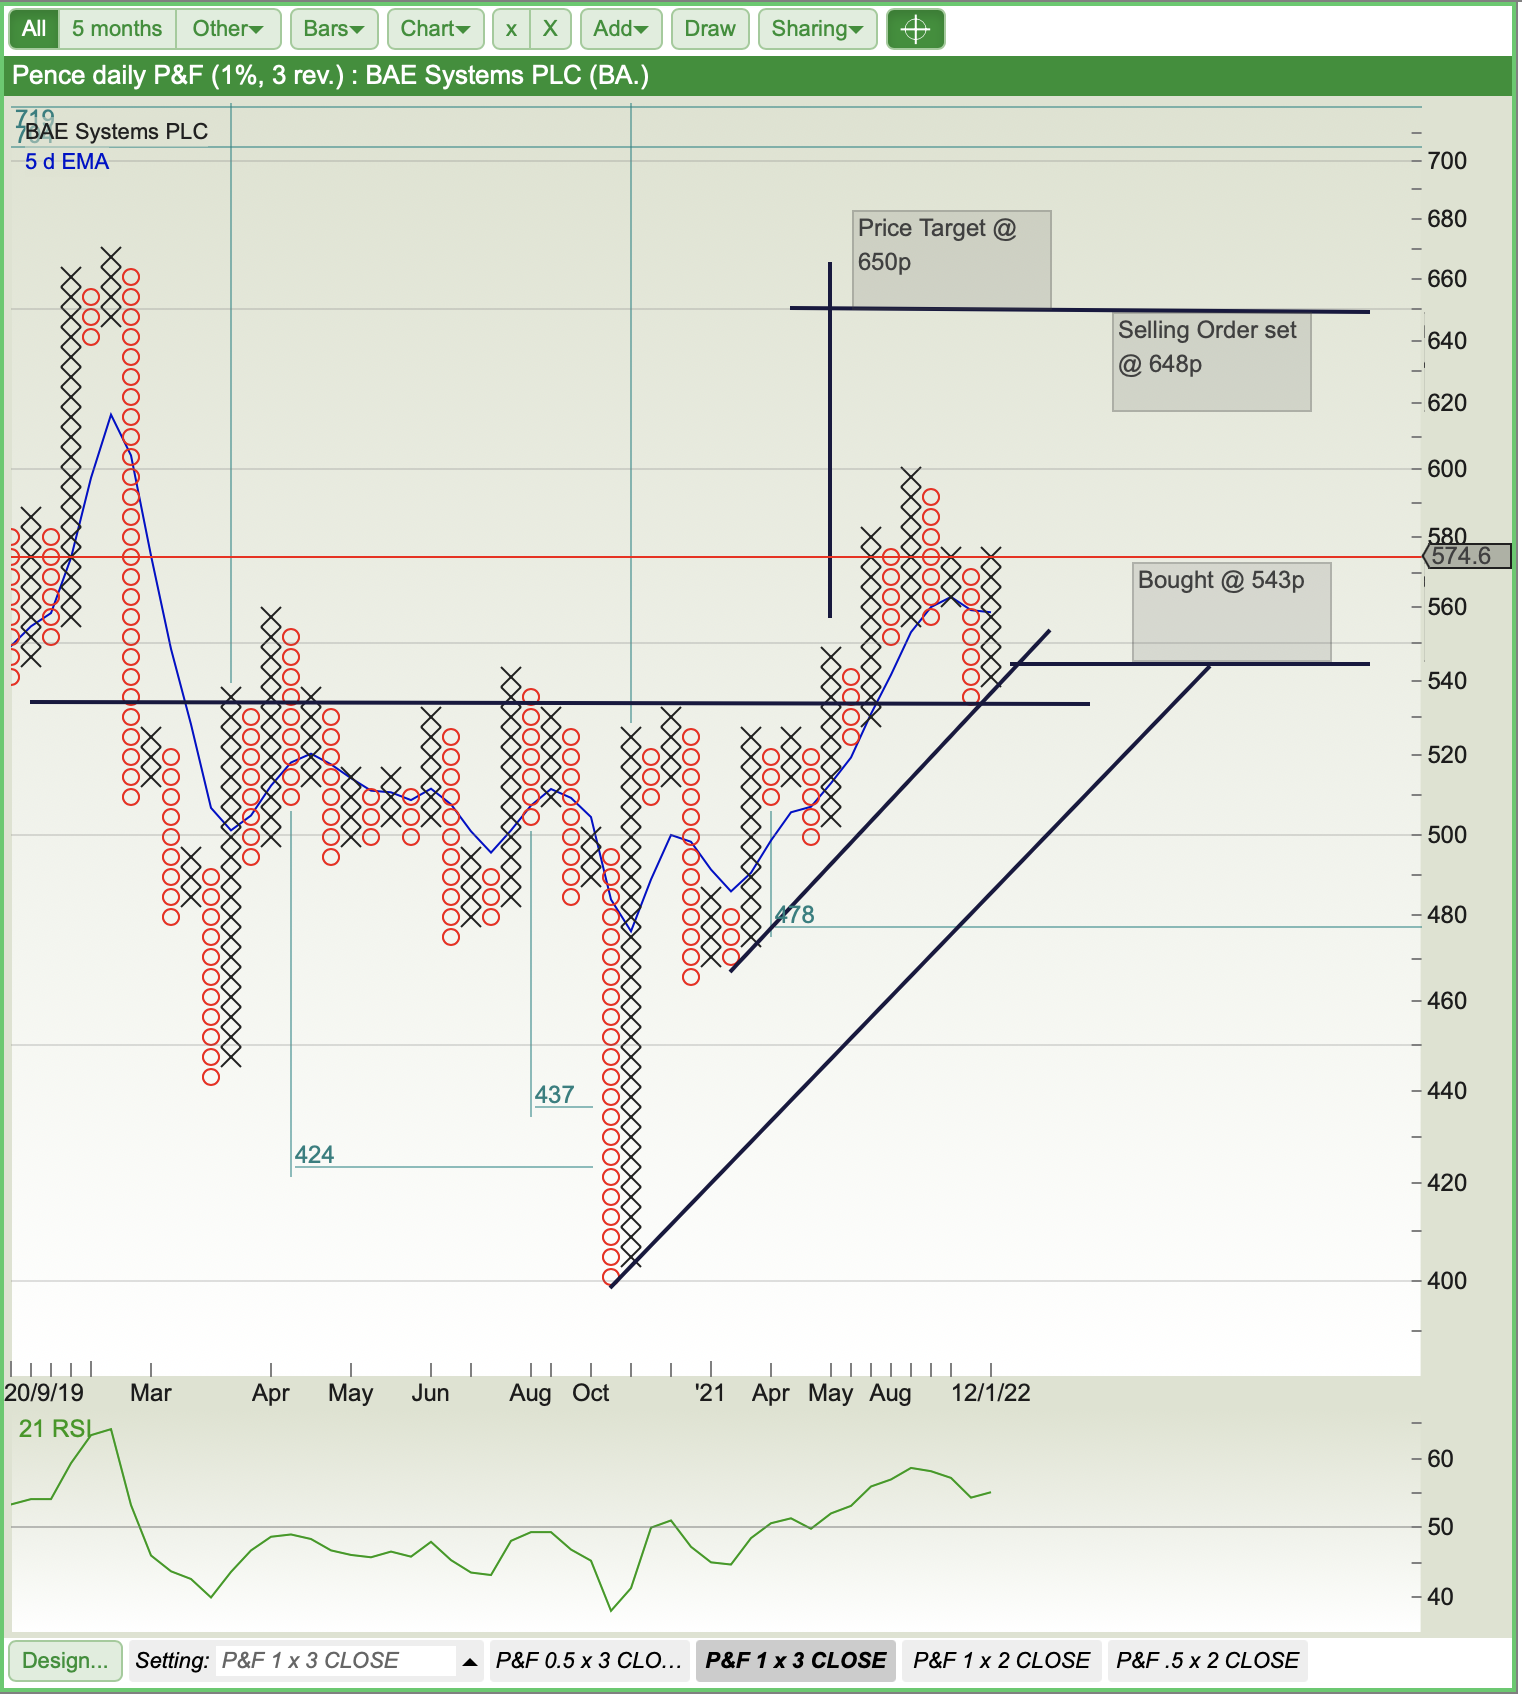
I bought at 543p once the share had started the next column of X’s off a strong support line. I have set my selling order at 648p. I will keep an eye on this and reassess as it gets closer to the target.
DRAX – DRX
I bought Drax in August 21 at 390.5p.
I used Drax as a bit of a test case to establish my rules for running with a trend. I bought Drax close to a support and downward price target on the 1% x 3 close chart. My initial aim was to sell at the 502p upward price target, but the price was driven up by the energy crisis.
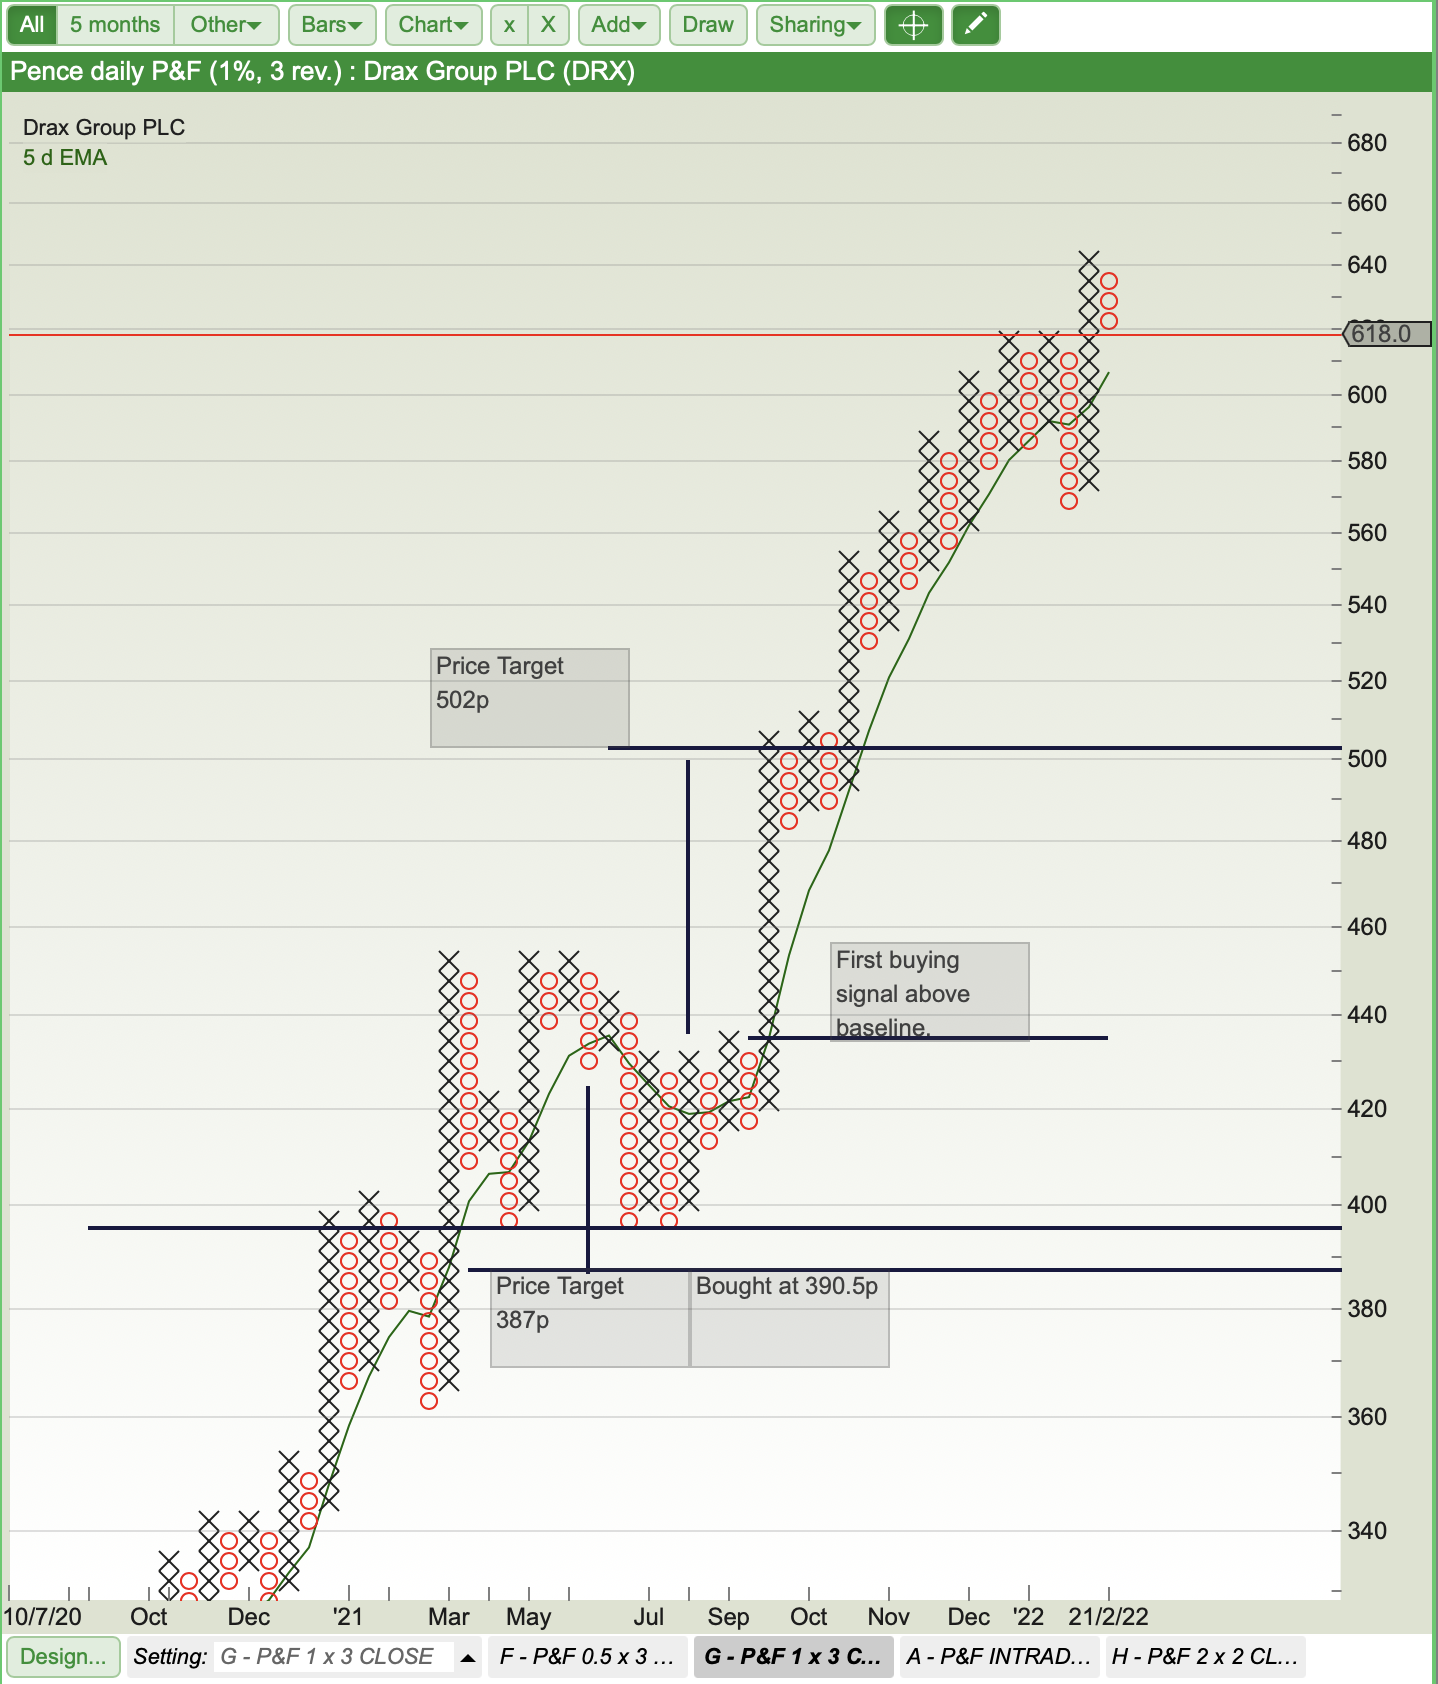
I added a 5 EMA to my 1% x 3 close chart to see if it could help me stay in with the trend before it signalled any weakness. It worked really well and I am still in this trade, but watching it closely.
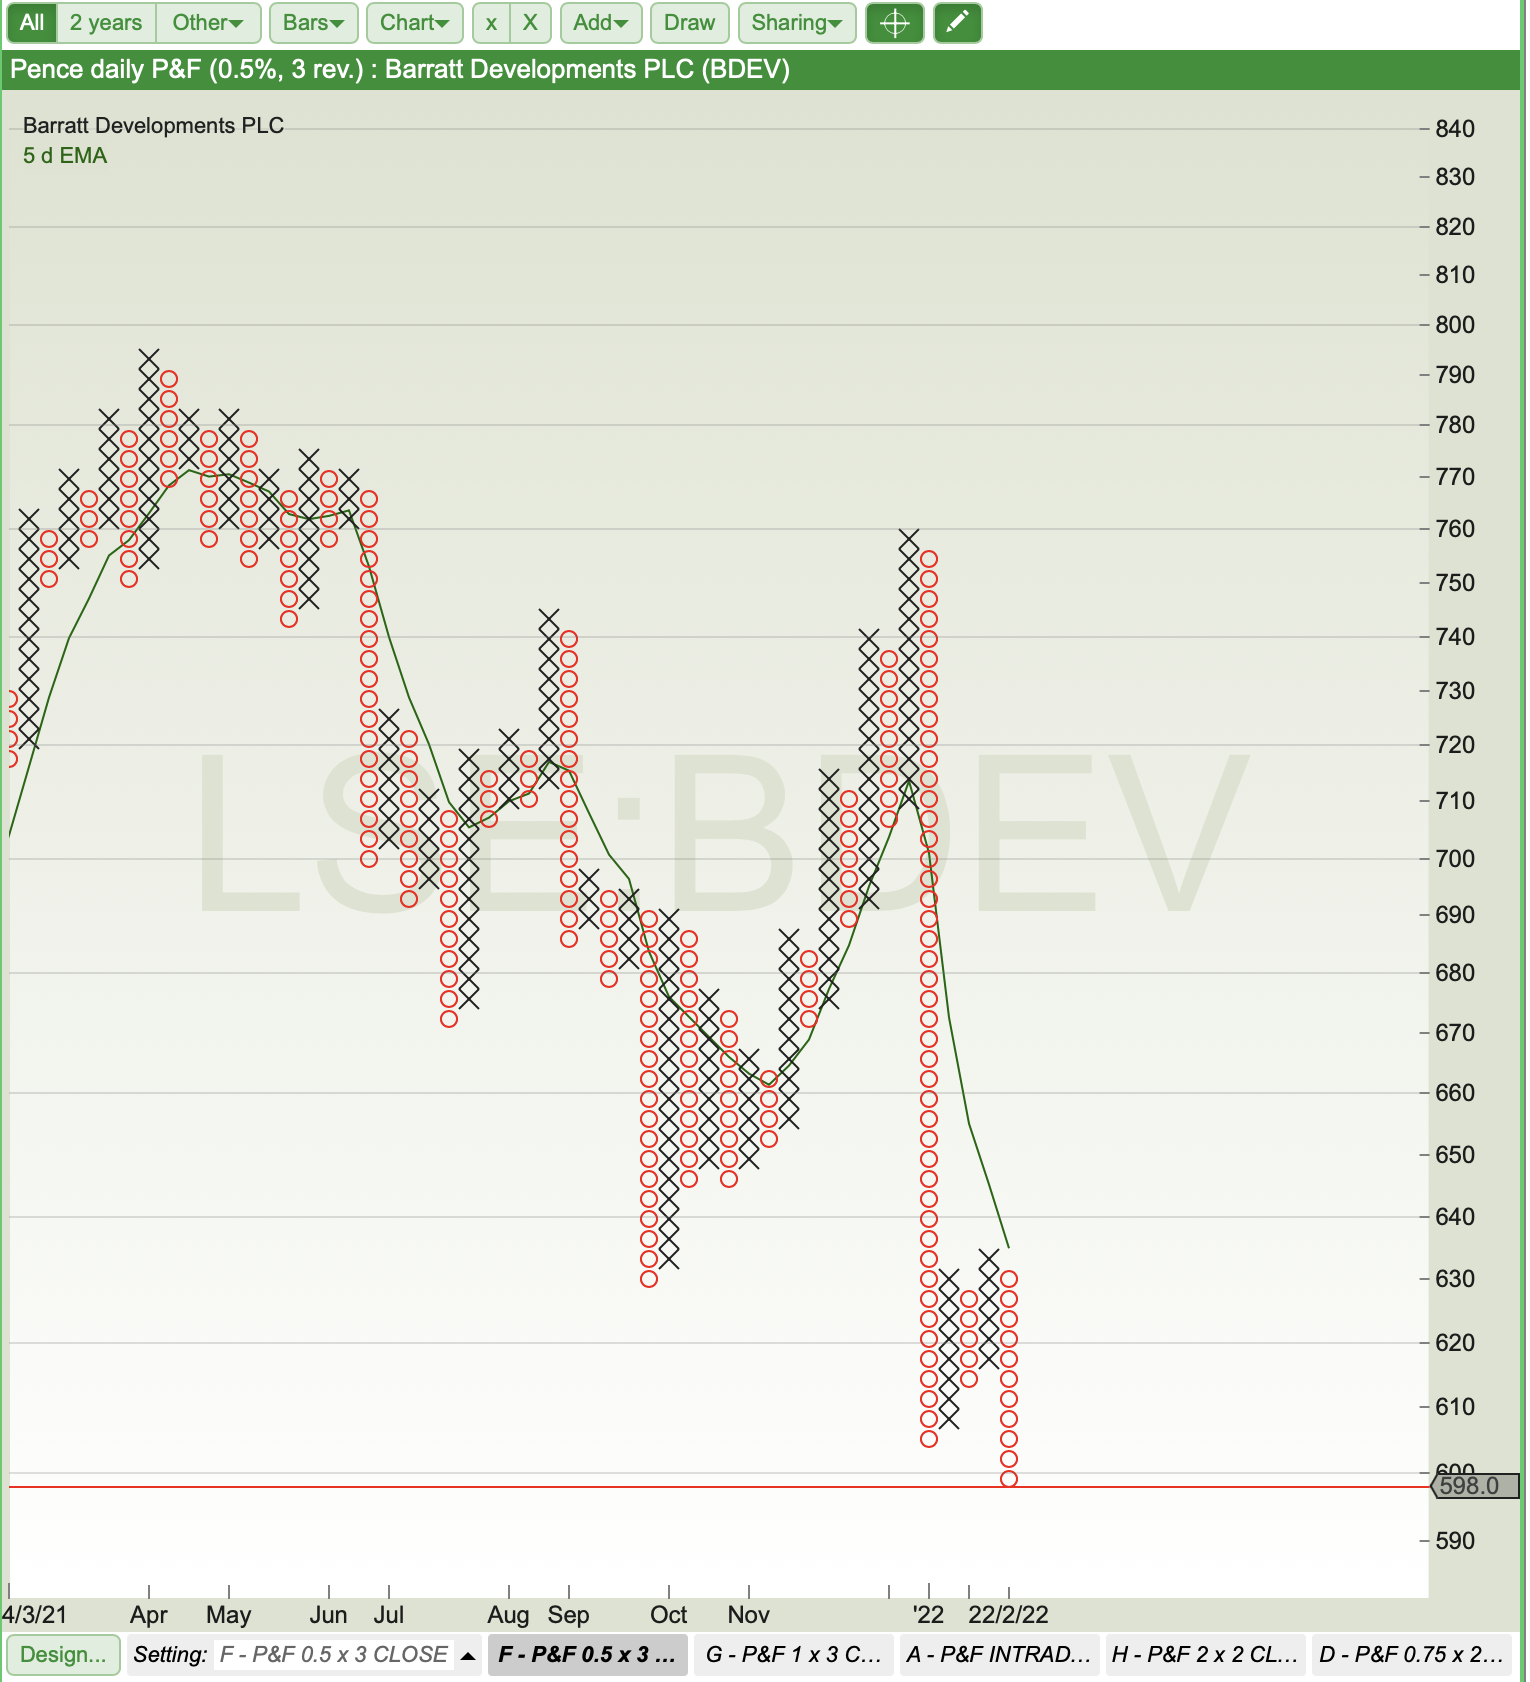
BARRATT DEVELOPEMENT – BDEV
I bought Barratts at 679p in November. I was aiming for a selling target price of 793p. It didn’t reach this target and dropped back in January. I sold out on the P&F selling signal from my 1% x 3 close chart at 696p. I didn’t feel confident about staying with this share in the same way I did with Drax given the cladding issue announcements.
I’m keeping an eye on Barratts with a view to repurchase once the 0.5% x 3 close shows a new buying pattern.
At the moment, with the current volatility in the markets, when looking to sell a share I am adopting Dr Elder’s analogy of “when the rabbit is big enough shoot it”. I am also working on basing some of my price targets on two box reversal charts. I will update you on this in my next blog and how it worked out.
Since recently adding a longer term 2% x 2 close chart into my analysis, it’s become easier to spot the bull/bear trend. As shares seem to spend most of their time trending in one direction or the other, if I buy a share that is bullish there seems to be a greater chance of that trend continuing – unless I am unlucky.
I need to remember that all I can control is when I buy and sell a share and how I interpret the psychology behind the creation of the point and figure charts. I have found learning about the Dow Theory really helpful.
William St John Bacon
Read William’s previous articles here and leave your top investing and trading tips for him in the comments section below.
This article is for educational purposes only. It is not a recommendation to buy or sell shares or other investments. Do your own research before buying or selling any investment or seek professional financial advice.


Hi William,
Great post – Good luck for the A-Levels this year
Love the P&F work – I prefer to see bars on a chart myself, but that’s just my personal preference
Very few people win at trading – Its hard, yet delightfully simple – Find a method that works, create rules for it and then just follow the rules regardless of the noise, news or views of others
Whilst employing Dr Elder’s rule, Consider a simple trailing stop method – Sometimes the markets just runs, netting you profits that would have been much lower if setting a target or say 3 or 5:1 – I had a trade last year in mid May 2021 in an ETF tracking the Nasdaq100, which returned 29R or as I risked 2% of my account on = 58% in just under 2 months by trailing a stop rather than set fixed price targets – let the rabbit get bigger and bigger and let it shoot itself!
If the method you trade hits targets and then retreats though it might be better to just stick with targets, if price often runs past targets though then might be worth considering, however, setting targets based on a higher time-frame is also a valid thing to do – I always look at the WEEKLY chart when trading from the DAILY chart and if a set-up shows up on the WEEKLY chart then it always gets my attention
As long as you keep everything in reality (there’s a lot of hyping in trader land) I’m sure you’ll do fine
Good luck on your journey, wishing you all the best in your trading journey
Hi THT
Thank you so much for taking the time to comment. It has been really helpful.
There are many times when targets for trades I have followed have been reached and exceeded. Whilst I find buying on P&F reasonably easy, I have found selling a bit more difficult outside of a price target range.
I now include two MA’s on my main P&F trading charts (1&6). This basic system works well for both buying and selling.
Following on from your great comments I have now set up a new trailing stop layout using daily line charts with optimised stop losses. On one page I now view all my on going trades at a glance. This is proving to be extremely helpful. So, once again, a big thank you for your help. Much appreciated.
Apologies for the delay in responding, but A Level revision is taking up most of my time!
Best wishes
William