

One of the best things you can do to really understand a business is to spend some time studying how and from where a company generates its revenues.
A series of simple and straightforward questions can allow you to gain a great deal of insight into how a company works. All of the information you really need to do this can be found in company reports and in SharePad.
Let’s get started.
Where do revenues come from?
Never be afraid to ask very basic questions about a company. You’ll be surprised how many investors cannot really tell you what a company does and where it makes it money from.
Look at the kind of products and services provided. What do they do to help its customers? Do lots of other companies do the same thing?
Is a company selling an essential product that customers will buy in all economic climates or is it something that can be easily put off when times get tough?
For example, a food retailer will have a lot more sustainable and resilient revenues than a company selling manufacturing equipment.
In one of the first notes to the company accounts you will usually see a breakdown of revenues by business line and geography. Look to see how make up of these revenues have changed over time and whether they are growing or not. Is a company revenues dominated by a particular business or product line? What’s happening to revenue trends here?
The geography of revenues is important as it can tell you how reliant a company is on particular countries. It also helps you identify sources of currency risk.
If a UK company has lots of its revenues coming from overseas then changes in the value of the pound will have a big impact on revenues when they are converted back into pounds. A rising value of the pound could reduce them whilst a weakening pound would increase them.
An often underappreciated source of revenue risk comes from having too few dominant customers. A company may be upfront about disclosing this in its annual results commentary but you will often find it hidden away in the risk section.
The quality of revenue growth
How a company generates revenue matters a great deal. Different sources of revenue are of higher quality than others.
The best source of revenue is increased sales from a company’s existing assets. This is sometimes called organic, underlying or like-for-like(LFL) sales.
With some businesses such as retailers you need to be a little bit careful with LFL sales due to something known as a maturation effect. This is when a new store’s sales are excluded from the LFL sales calculation in its first year but are included in year two when sales levels are still maturing to their potential level.
A company can therefore seem to have a growing LFLs when it actually just the maturation effect of new stores. There is a big difference in how you interpret this and genuine LFL from a mature store or asset.
The other thing to watch out for with retailers is over expansion – opening too many stores. This can lead to something known as sales cannibalisation where a new store opened close to an existing one can take sales from it whilst not reaching the revenue levels of previous new stores.
Overall sales for the company will still grow but the quality of sales growth will be poor as the profit per store will be reduced.
Declining underlying growth is often the first sign that a company is coming under competitive pressure or demand for what it sells is weakening.
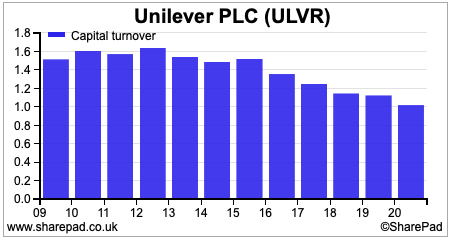
The next best source is from investment in new projects. One of the best ways to check how effective a company’s investment has been in generating sales is to calculate its capital turnover ratio. This tells you how much revenue a company generates for each £1 of money invested.
You can do this easily in SharePad and look at how it has changed over time by creating a financial chart.
Buying sales by acquisition is usually seen as the poorest source of revenue growth. That said, if it means that a company gains exposure to a new growth market then this would generally be a positive development.
Finally, it is important to find out what is driving the growth for a company’s products and services. The best form of growth will be driven by a long-term growth in demand rather than taking market share from competitors in a stagnant market.
Volume vs price
Ideally you want to see a company growing revenues by a combination of selling more stuff and an ability to increase prices, perhaps by selling more premium products.
Volume growth shows an increase in demand from customers. However, growing volumes often cones with more costs and possibly requires more investment.
The ability to therefore get some more revenue growth from putting up prices is also very important. This has become even more so during the current period of higher inflation.
A company with declining volumes or too reliant on price increases is often a sign of a business in trouble. This could be seen very clearly with businesses such as Sainsbury’s in the late 1980s and early 1990s and explained why Tesco was able to take customers from it.
Seasonality of revenues
Some companies have fairly steady sales patterns throughout the year. Others such as tourism or retail can have seasonal peaks in the summer of at Christmas.
Seasonality can introduce more risk into a business. For example, a weak Christmas selling season can see a retailer generate much lower profits which could lead to a big fall in its share price.
Kitchen supplier Howden Joinery’s peak sales occur in October and November each year as many people want a new kitchen fitted before Christmas. You can see the seasonality in its revenue (turnover) and how it is much bigger in the second half of its financial year (I’ve used 2019 as a pre-Covid year to demonstrate this) than in the first half.
Its fortunes in the peak selling season therefore have a major impact on its full year profits.
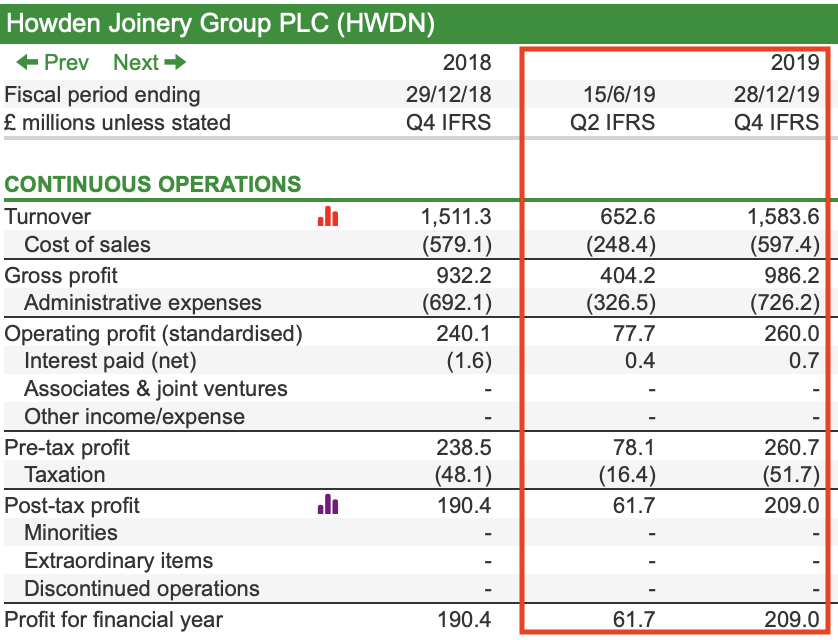
Source: SharePad
An over-reliance on credit to grow sales
Companies can grow their revenues by making it easier for customers to pay for their products or services. This often done by giving them time to pay in the form of credit.
There’s nothing wrong with this as long as a company does not become too reliant on credit to grow and starts giving it to customers who cannot pay it back.
One way of looking for deteriorating credit sales is an increased ratio of trade receivables to revenues. This can be a sign that the risk of bad debts and lower profits is increasing.
You can look at the trend of trade receivables (or debtors) to revenues over time in SharePad with a financial chart.
A chart like this would get me to raise my eyebrows a little. Bytes Technology has been growing its revenues at a decent rate in recent years but its trade debtors ratio has been increasing significantly at the same time.
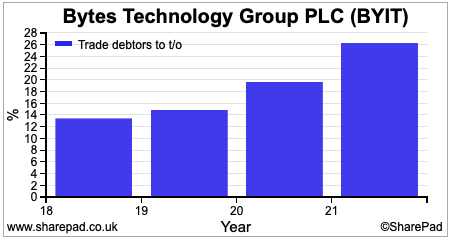
You definitely want to find out the reason for this as it can be a sign of overtrading and bad debt risk or a more powerful customer that can dictate more favourable payment terms. There also may be a reasonable explanation for it.
Phil Oakley
This article is for educational purposes only. It is not a recommendation to buy or sell shares or other investments. Do your own research before buying or selling any investment or seek professional financial advice.


