
A cash flow analysis of a company has long been seen as a good thing for an investor to do. Often, if you want to get a feel for what’s really going on with a company and the numbers it produces, its cash flow statement will tell you a lot more than its income statement.
One of the most popular and useful numbers that can be calculated from a cash flow statement is something known as free cash flow (FCF). Many investors rely on free cash flow as their way of measuring a company’s business performance and valuing its shares.
Free cash flow has a lot going for it.. However, as with many numbers used in investing it’s a good idea to try and understand what they mean and how they come about.
In this article, I am going to show you the wealth of free cash flow data that is available in SharePad and how you can construct tables and charts to improve your free cash flow analysis of a business.
What is free cash flow?
Free cash flow refers to the amount of cash that a company has left over after it has paid everything it needs to pay to stay in business.
In other words, it is the cash that the company is free to do with as it pleases. This can be used to pay dividends, buy back shares, make acquisitions or repay debts.
There is no accepted calculation of free cash flow but for an investor looking at a UK company, I would calculate it as follows:
FCF= Operating cash flow + dividends and interest received – tax paid – interest paid – capex – preferred dividends.
SharePad does it the same way.
Sometimes you will get figures such as net operating cash flow which is operating cash flow less tax. Occasionally, depending on the type of business concerned, interest and capex can be deducted in the calculation of operating cash flow. SharePad sorts out these numbers for you so you don’t have to worry about them.
Capex refers to the money spent on tangible and intangible assets. It should also include the repayment of capital on operating leases. Some investors try to adjust the capex figure to just include maintenance or “stay in business” capex when calculating free cash flow.
Unless the company tells you what this number is, it’s not easy to work out but some use depreciation and amortization as a proxy for maintenance capex. SharePad calculates free cash flow by deducting all capex.
Once you have a free cash flow number, it can be used to learn many things about a company and its shares. However, you need to be aware of how a company generated its free cash flow and that free cash flow may not always be a good substitute for a profit or earnings figure from the income statement.
Free cash flow in SharePad
Here is a table with the main free cash flow numbers and related ones that you can find in SharePad.
As with my previous article on return on capital employed (ROCE), I am using a portfolio of electrical engineering and industrial companies as my sample.
I’m now going to go through these different numbers separately and show you what you can learn from them and why you might find them useful.
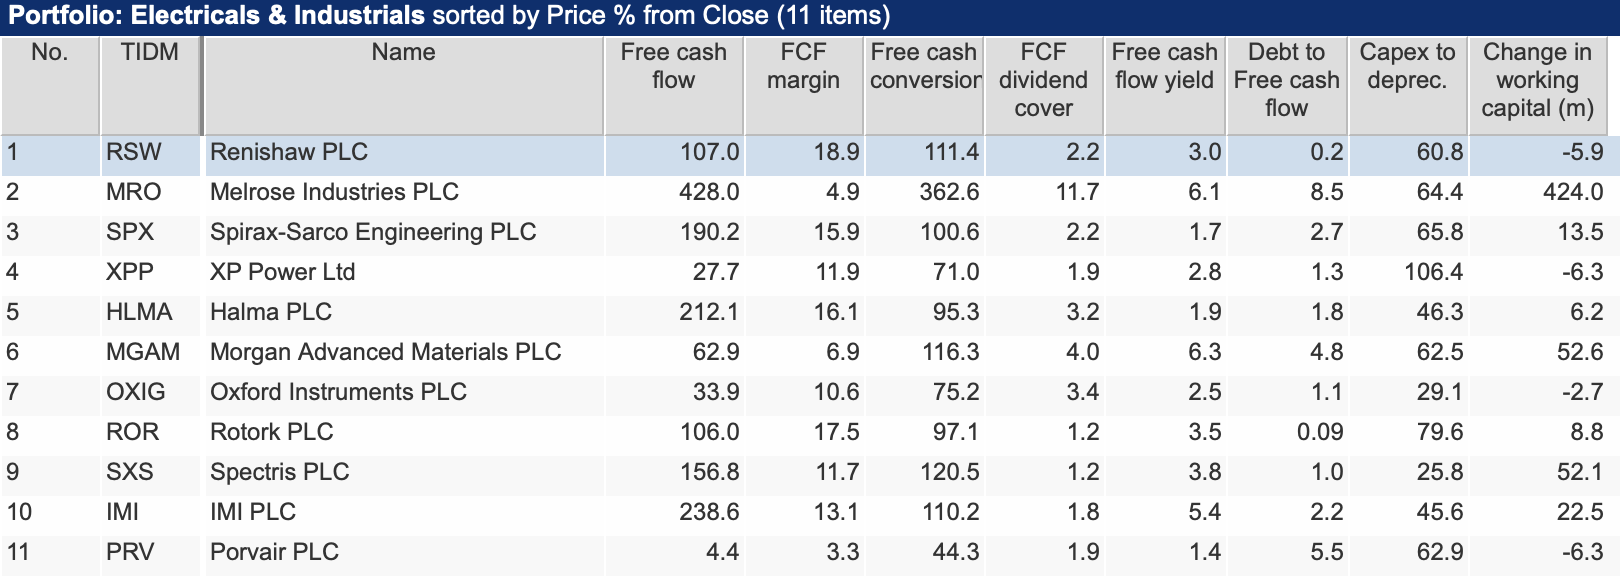
Source: SharePad
Free cash flow
The table shows the latest annual free cash flow for a company. The fact that they are all positive in the table is generally seen as a good sign.
Negative free cash flow is not always a bad sign as a company may be investing its cash flow into projects that will produce lots of cash flow in the future and may be sacrificing free cash flow today for a much bigger free cash flow number in the future.
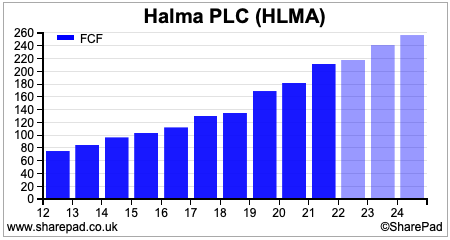
The free cash flow number on its own doesn’t tell us much. As with most numbers, you should look at the trend in free cash flow. A trend of growing free cash flow is usually a good sign.
I find SharePad’s financial charts feature as the best way to look at trends.
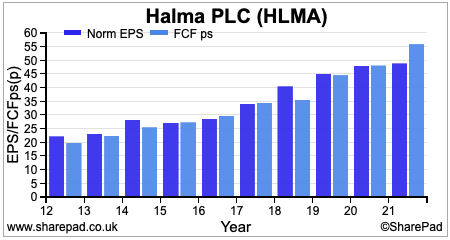
As you can see, Halma has been very good at growing its free cash flow in recent years. The lighter bars show forecast free cash flow. I do not know how SharePad’s data provider calculates FCF and whether the fall in FCF in 2022 is comparing like with like.
Free cash flow margin
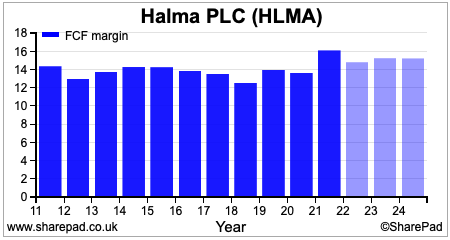
This shows how much of a company’s revenues are turned into free cash flow. Generally, it’s a case of the more, the better. High and sustainable free cash flow margins can be a sign of an outstanding business.
Halma’s free cash flow margin has been stable and at a reasonable level. As a general rule of thumb free cash flow margins of more than 10 per cent are reasonable and anything consistently above 15 per cent is very good.
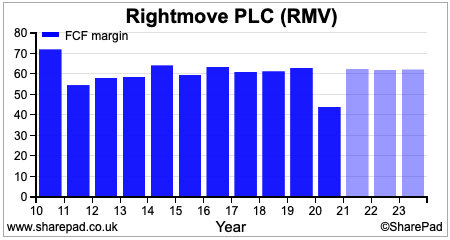
Rightmove is one of the most impressive UK listed companies when it comes to free cash flow margins.
Free cash flow conversion
Good businesses consistently convert their post tax profits into free cash flow or their earnings per share(EPS) into free cash flow per share (FCFps).
A company that doesn’t convert profits into free cash flow can be a sign of profit manipulation and needs to be checked out.
Halma scores well when looking at free cash flow conversion.
Free cash flow dividend cover
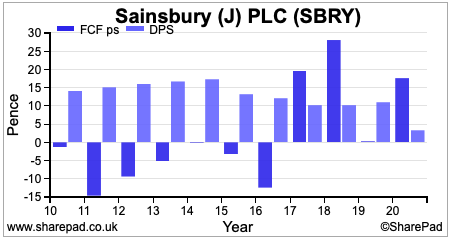
If you are buying a company for its dividend income, one of the best checks you can do on dividend safety is to see if it can be paid from free cash flow. Weak free cash flow and low free cash flow dividend cover are often the warning sign of an impending dividend cut as it was with Sainsbury’s in the early part of the last decade.
It’s current dividend looks a lot safer on this test at the moment.
Free cash flow yield
This is a very popular way of valuing shares. It is the free cash flow per share expressed as a percentage of the current share price. The yield is then often compared with the yield on government bonds and comparable shares.
Investors searching for bargains often look for shares with very high free cash flow yields but you need to be mindful that sometimes high levels of free cash flow are temporary or not sustainable.
A low free cash flow yield can be a sign that a share is very expensive. This is clearly the case with Halma which only has a yield of 1.9 per cent. To get a yield on the current share price to a more acceptable level, Halma is going to have to grow its free cash flow very strongly in the future.
It’s very easy to use SharePad to look for companies with high free cash flow yields. Here, I’ve also asked it to only look for companies in the FTSE 100 with very high free cash flow margins.
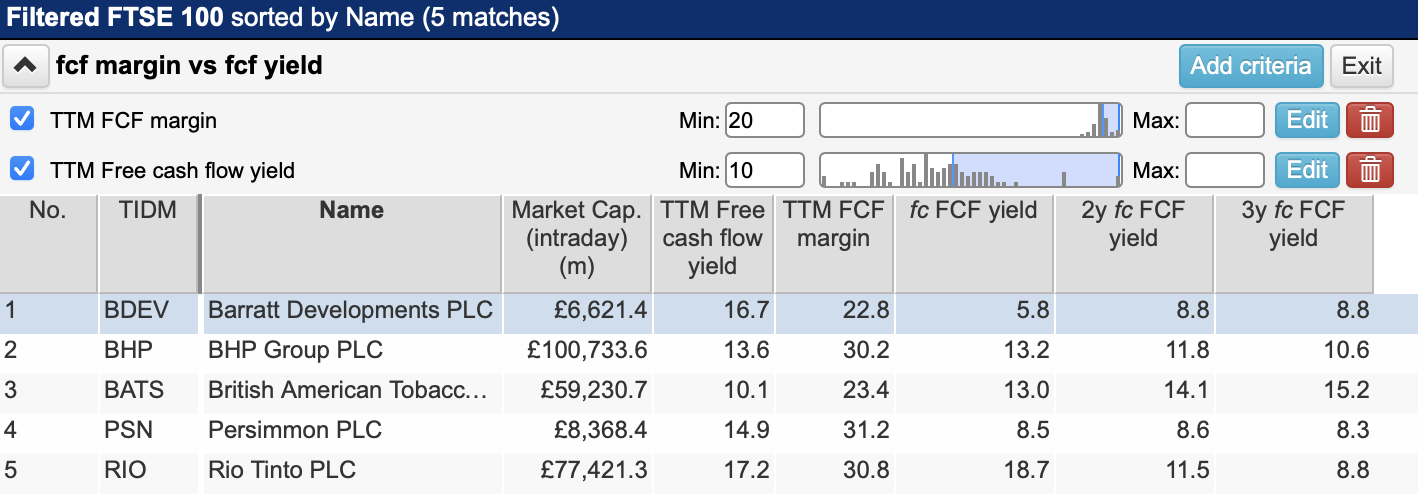
I’ve also added forecast free cash flow yields for the next three years to my results to get a feel of whether investors think free cash flow is sustainable. Are these shares too cheap?
Debt to free cash flow
This ratio tells you how quickly a company could pay off all its debts with its current level of free cash flow.
Personally, I find this a much better measure of a company’s indebtedness than the very popular net debt to EBITDA (earnings before interest, tax, depreciation and amortization).
EBITDA is not a very good measure of a company’s debt paying capability because interest and tax payments are not negotiable, whilst a company has to replace its assets (depreciation being a proxy for how much the annual cost of doing this might be) if it wants to stay in business.
With perhaps the exception of Melrose, none of our companies listed above look to have uncomfortable levels of debt.
Can you trust free cash flow numbers?
Profits are based on something called matching or accruals. This is when costs are matched against the revenues they generate. This is not the same as when cash flows are received and paid which is shown up in the cash flow statement.
I like the principle behind accruals and think it makes sense.
There’s always been a lot of talk about how profits are easily manipulated but cash flows can be too. There are four main ways a company can boost its free cash flow in the short term:
- Cutting back on capex so that it is below the depreciation expense. Unless a company is over depreciating and stating its profits very conservatively, a company cannot do this for long before assets start to wear out and stop generating revenues. But cutting back on investment and capex boosts free cash flow but it does not necessarily make shareholders better off.
- Running down stock levels frees up cash flow. If a company has too much stock this is a good thing to do but it is usually a one off event. Quite often a company will build up stocks in anticipation of strong future demand. This will reduce free cash flow. Are shareholders really worse off because of it? The opposite is likely to be true.
- Getting customers to pay their bills faster – this will be seen as a reduction in trade receivables and a cash inflow. It will boost free cash flow for the year concerned but it doesn’t mean that the company has sold more products or services.
- Paying suppliers later. Companies often delay paying their suppliers to boost cash flow. This can be shown as an inflow of cash (as an increase in cash or payables) if the company has increased the amount it owes year on year. This will increase free cash flow but the bills will still have to be paid and will have been expensed in the income statement. The boost to free cash flow that results is not an increase in value of a business. It’s just a matter of timing.
You also need to be mindful of subscription businesses in industries such as publishing and software. Annual or multi-annual subscriptions are often paid up front which can give a massive boost to free cash flow in the form of an increase in payables (deferred revenue).
But this is money the company has not earned. Ask yourself whether you should be using free cash flow as a measure of business performance or valuation for companies like this? I would not.
You can use SharePad to see how capex and working capital cash flows (the changes in stocks, receivables and payables) may have influenced free cash flow.
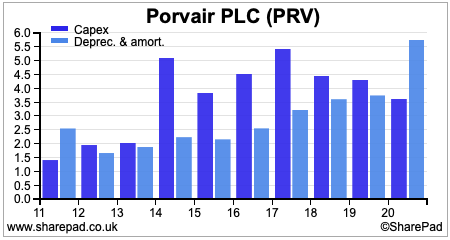
SharePad calculates the capex to depreciation and amortization ratio as a percentage. 100 means that capex exactly matched depreciation with anything below 100 showing that capex was below depreciation.
Using a financial chart is a good way to check out this relationship over time.
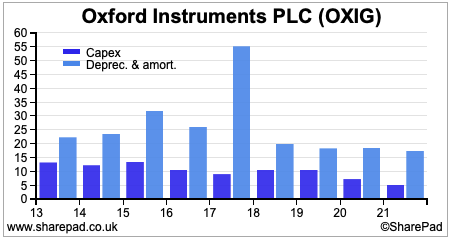
Based on this chart, it looks as if Oxford Instruments may be seriously under-investing in its business. However, a closer look at the numbers reveals that there has been a significant amortisation of acquired intangibles that relate to items such as brands that come with acquisitions. This is not matched with an annual capex sum and will be expensed against revenues with advertising.
For much of the last decade, Portvair has spent considerably more than depreciation on capex, which perhaps explains why its free cash flow margins are lower than its peers.
In SharePad, you can select a data column which shows you the cash inflow and outflow from changes in working capital. You can then compare this with the free cash flow number to see how big an impact it had on that year’s number.
It might pay to be wary of basing investment decisions on free cash flow numbers that have been flattered by cutting back on investment and generating short-term cash flow from working capital.
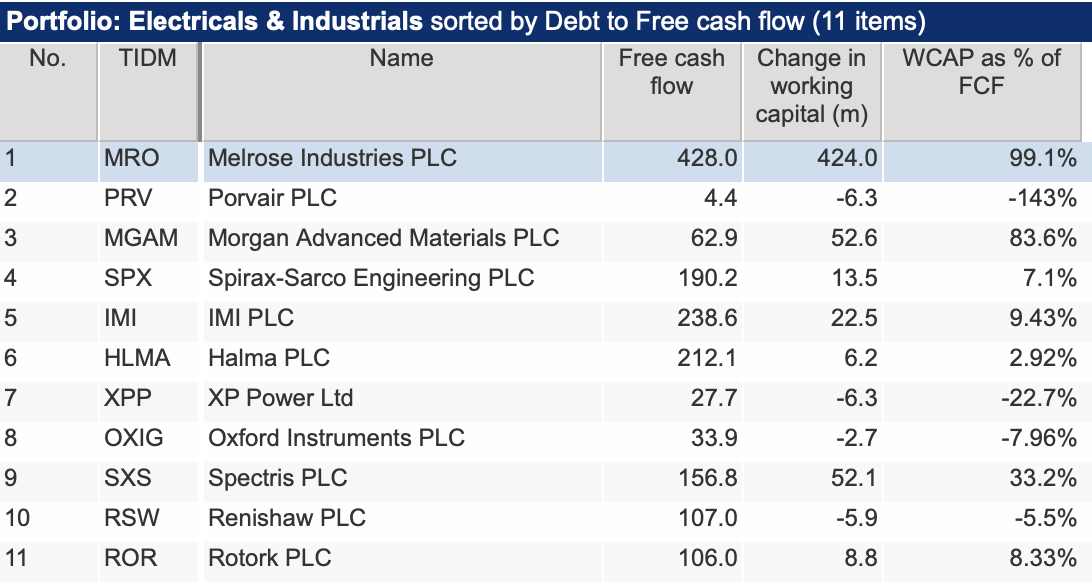
In this table, I’ve used the combine items feature to add a column that gives the change in working capital cash flow as a percentage of annual free cash flow.
This gives you a feel for how big an impact it can have on free cash flow. It shows that virtually all of Melrose’s free cash flow came from working capital inflows last year. If Porvair had not had a working capital cash outflow, its free cash flow would have more than doubled.
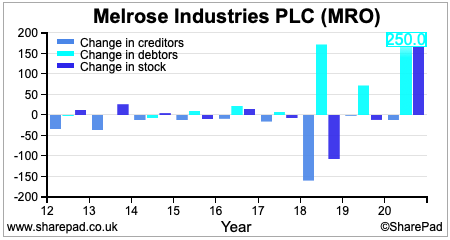
Again, one of the brilliant things about SharePad is that you can use its financial charts to get a better feel of its working capital cash flows.
Here’s a closer look at Melrose
Final thoughts
Free cash flow is a very important number in financial analysis but needs to be used with care. It’s not the same as profits and changes in free cash flow may be more a reflection of the timing of payments and receipts rather than changes in company value.
Hopefully you will have seen how SharePad can do wonders for your understanding of a company’s free cash flow.
Phil Oakley
This article is for educational purposes only. It is not a recommendation to buy or sell shares or other investments. Do your own research before buying or selling any investment or seek professional financial advice.


