
If you look DotDigital, as I did a few years ago, you will find much to like about the business:
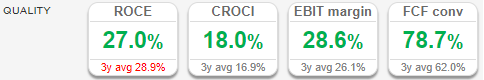
Source: SharePad financial summary
It is highly profitable in terms of Return on Capital Employed and profit margin.
The exciting thing about a company like this is, as long as it can reinvest the cash it earns at a similar rate of return it should grow handsomely. Perhaps it will grow enough to justify its high price earnings ratio.
Just to recap slightly, DotDigital’s software sends us marketing by email and text message. It has grown both revenue and profit at a compound annual growth rate of 20% over the last decade or-so without recourse to debt.
Cash conversion
Investors like companies with strong cash flows because cash flow is less prone to accounting shenanigans than profit.
DotDigital’s three year average free cash flow conversion ratio, the right-most box in SharePad’s financial summary is 62%. That means the free cash flow figure, the average amount of money the company had left over after paying operating costs and the investment required to maintain operating assets was only 62% of average earnings (profit).
When there is a sizable discrepancy between a company’s performance in terms of profit and free cash flow, say cash flow is less than 75% of profit, it is a good idea to find out why because they measure the same thing in different ways. They measure the surplus owned by investors that can be used to pay a dividend, pay off debt, or invest in new projects.
Perhaps the easiest way to demonstrate this is through Depreciation and amortisation, which is relevant to DotDigital’s cash flow as we will see.
Depreciation is an accounting convention used to spread the cost of physical assets, property, plant and equipment, over the period they are expected to be used. Amortisation is the same thing applied to intangible assets like software.
By way of example, we will use a more dramatic example than DotDigital. Treatt is building its new headquarters this year, which involves new property, plant, and equipment. The cost is much higher than annual profit, and if it were not depreciated the firm would report a substantial loss. In fact, the company, which makes flavours for beverage companies is doing very well, which is why it needs a new headquarters.
It is pretty obvious that Treatt’s profit is a much better measure of its performance than cash flow, but the precise level of profit will be decided by the company itself. Guided by accounting rules, it will determine how long the assets will last, and whether to depreciate them by the same amount each year or by a more complicated method. These judgements determine the annual depreciation charge, the cost to be deducted from profit each year.
The profit figure is a better measure of performance in a given year, but it is subjective, and because it is to their advantage to be profitable, some companies exploit these ambiguities.
I doubt Treatt or DotDigital does, but it is important to know what is going on.
Comparing free cash flow to profit
By looking at the cash flow statement in SharePad we can see how the company’s cash is being spent and how it is being invested. This is DotDigital’s cash flow statement:
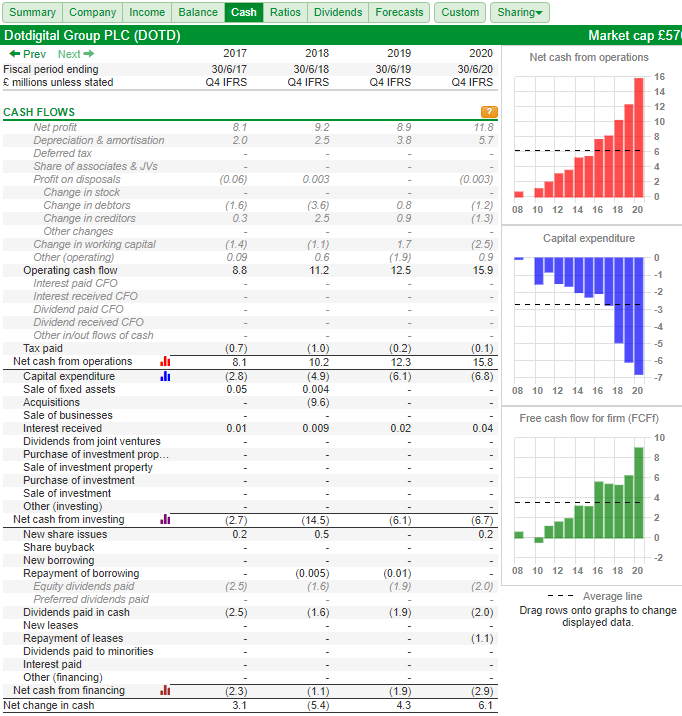
Source: SharePad. The Cash tab shows a summary of the cash flow statement. On the right are charts of the two main components of free cash flow: Net cash from operations and capital expenditure.
Instead of listing all of the cash inflows and outflows and netting them off, the first section of the cash flow statement starts with profit and strips out the judgements made by accountants to arrive at operating cash flow.
Perhaps you can see just by skimming your eyes across the rows that the biggest adjustments are Depreciation & amortisation (row 2) and change in working capital (row 10).
It can be difficult to see though, as cash flows are volatile from year to year. To get a clearer picture we can total each of the significant rows. To keep things simple I have totalled the last three years, but going back further tells a similar story:
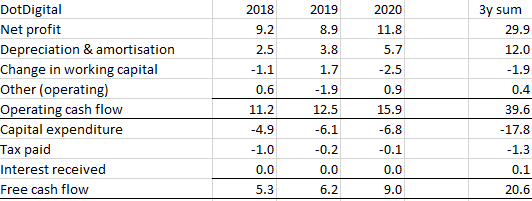
Data source: SharePad. Data was exported using the sharing feature and summed in a spreadsheet.
In the table above I have lumped all the small adjustments in the reconciliation together in “other adjustments”, to show the potentially significant ones: Depreciation & Amortisation (£12m) and the Change in working capital (-£1.9m). Most of the discrepancy between profit and cash flow relates to these items.
But cash flow from operations is not comparable to profit because we have added back Depreciation and amortisation but not deducted the cash cost of investment, which is capital expenditure. Because capital expenditure is not a day to day (operating) expense but investment for the future, it is itemised in the second section of the cash flow statement.
Other investment items are not relevant to the free cash flow calculation. DotDigital spent £9.6m on an acquisition in 2018, for example, but acquisitions are not required to maintain existing operations.
We also need to account for tax and interest, but these are much smaller items.
The difference between depreciation and capital expenditure is £5.8m (£17.8m-£12m) over the three year period. It is the biggest contributor to a £9.3m discrepancy between profit and cash flow (£29.9m-£20.6m) but it is probably not much to worry about.
Companies rarely tell us how much cash they invest to maintain their assets. There are ways to estimate so-called maintenance capital expenditure, but they are guesstimates, and in practice most investors just use total capital expenditure. This is how SharePad calculates free cash flow and it almost certainly understates DotDigital’s performance.
If DotDigital’s cash flow was only sufficient to maintain its assets then in theory capital expenditure should be very similar to depreciation. The fact that it is not suggests DotDigital is investing more than it needs to and the additional capital is intended to grow the business.
Capitalised development costs
But there is an additional source of uncertainty stemming from the nature of DotDigital’s capital expenditure. In common with many other software companies, much of DotDigital’s capital expenditure is capitalised development costs.
Sometimes companies identify capitalised development costs in their cash flow statements but DotDigital identifies only two capital expenditure items: Purchase of intangible fixed assets and Purchase of tangible fixed assets (also known as property, plant and equipment).
Nearly all capital expenditure was on intangible fixed assets:
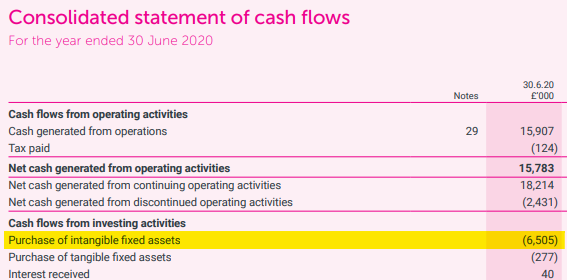
Source: DotDigital Annual Report 2020
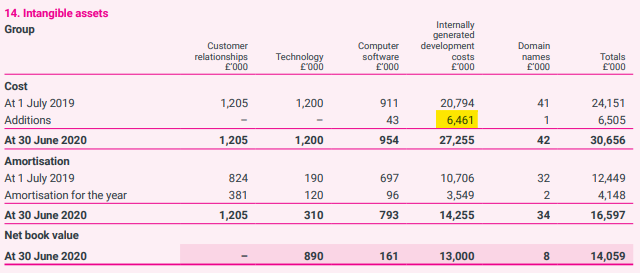
Note 14 (Intangible assets) in the company’s annual report shows us what these intangible fixed assets were. Almost all of the additions to intangible assets were internally generated development costs, which is another name for capitalised development costs.
The remaining £43,000 was spent on third party computer software.
Source: DotDigital annual report 2020
Third party software is treated much the same way property, plant and equipment is. The cost is spread out over its useful life and amortised (depreciated).
But internally developed assets introduce another level of judgment because the product they will develop is not yet being sold and we cannot know what it is worth. The rules say blue-sky research cannot be turned into an asset (capitalised) because its value is too uncertain. It might amount to nothing at all.
But if the company is working on a specific project that is commercially viable and will earn more than it cost to develop, it can turn the costs of development into an asset rather than deduct them immediately from profit. For a software company that will often be the salaries of the software developers working on a new product or product feature.
At what point a project becomes commercially viable, and how confident we need to be that it will be profitable, is of course, is a judgement call.
Some conclusions
DotDigital’s average Return on Capital is high (29%), which marks it out as a successful business.
Profit, though, is a subjective number determined by accountants who have an interest in making the company look good.
Free cash flow is a more precise measure of a company’s performance but for growth companies it understates performance because it is distorted by, among other things, heavy investment.
Comparing free cash flow and profit using the cash conversion ratio illuminates the judgments accountants have made when they arrive at the profit figure.
DotDigital’s average three year cash flow per share is 62% of its earnings per share. Worst case then if the accounting is all shenanigans (not likely) and free cash flow better accounts for its performance (also not likely), the true return on capital is about 18% (62% of 29% Return on capital).
I think most investors would be happy with that.
Richard Beddard
Contact Richard Beddard by email: richard@beddard.net or on Twitter: @RichardBeddard
This article is for educational purposes only. It is not a recommendation to buy or sell shares or other investments. Do your own research before buying or selling any investment or seek professional financial advice.


