
Let me start by thanking you for clicking on an article with Headlam in the title.
Rest assured, not everyone will want to read about this rather dull business that has suffered badly during the pandemic.
But for us contrarians, now may be the time to consider such stocks — unloved names that the market rebound has left far behind.
Headlam seems to possess the industry position, balance-sheet strength and management experience to survive this downturn and recover thereafter. A full share-price recovery could even offer a potential 100% gain.
Filter results
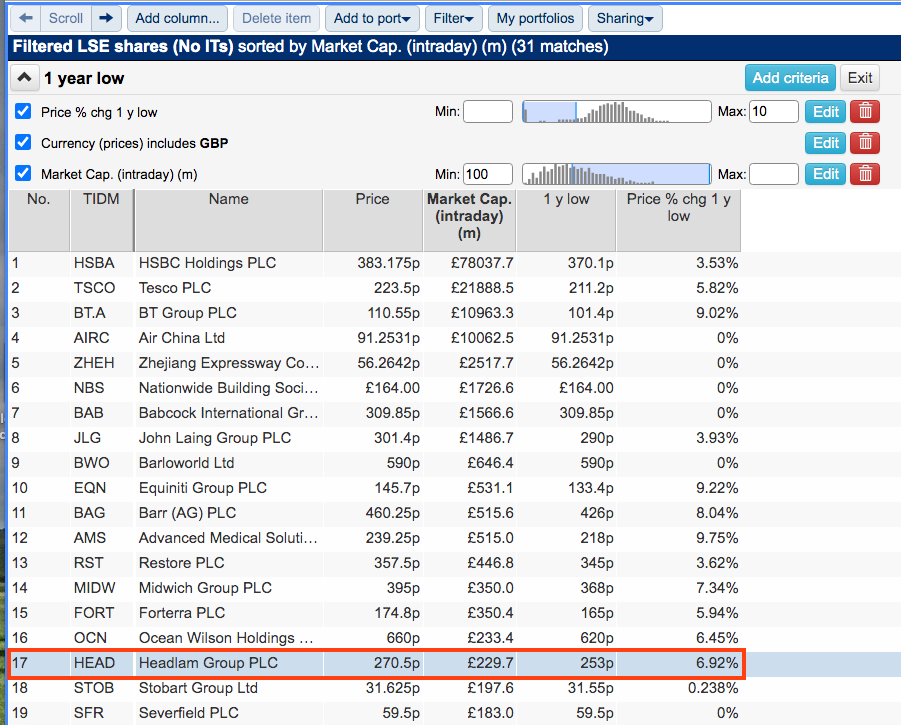
I identified Headlam by employing a very simple SharePad screen. The main filter I applied for my contrarian rummaging was a share price within 10% of the one-year low.
I also eliminated shares traded in a foreign currency and market caps of less than £100 million.
You can run this screen for yourself by selecting the “Maynard Paton 15/07/20: Headlam” filter within SharePad’s helpful Filter Library. My instructions show you how.)
SharePad returned 31 matches, including AG Barr and Victrex.
I chose Headlam for further analysis because the company had appeared on my radar during this SharePad webinar. Attractions back then included:
- Impressive cash generation and working-capital management;
- A balance sheet carrying significant freehold assets and net cash, and;
- A veteran chief executive.
Sure enough, Headlam’s share price has not rebounded following the March lows:
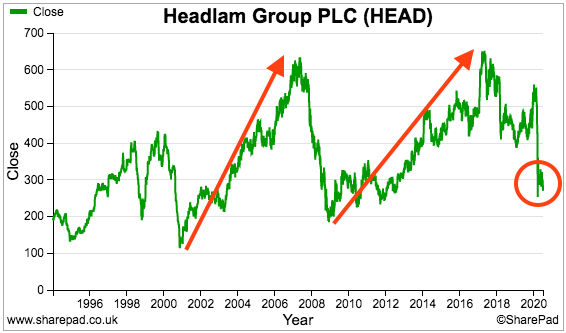
In fact, the shares at the recent 270p are back to a level seen eight years ago and first seen — incredibly — way back in 1996.
The price chart does imply the company has recovered twice in the past — first between 2001 and 2007 and then between 2009 and 2017. On both occasions the shares at least tripled in value.
Perhaps the Covid-19 downturn could create a hat-trick of turnaround buying opportunities.
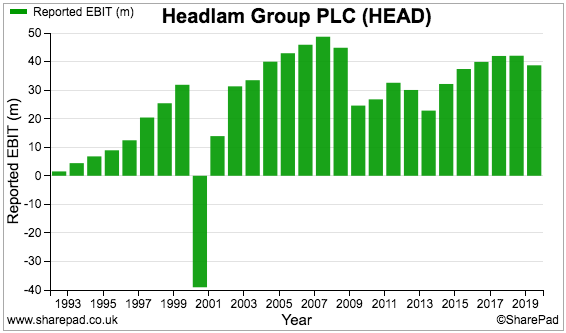
The up-and-down share price reflects an up-and-down financial history.
Although revenue has advanced steadily over time…
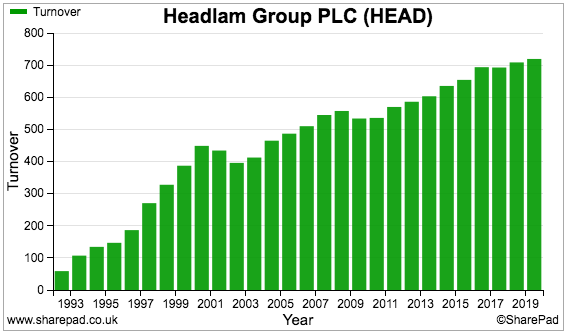
…reported profits have not been so consistent.
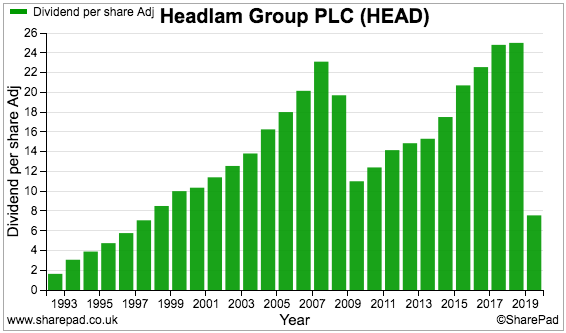
The dividend suffered a major ‘re-basing’ during the banking crash and has suffered another during the pandemic:
Let’s take a closer look at the company and its recovery prospects.
The business of Headlam
Headlam’s stock-market history stretches back to 1948 when the firm listed as Headlam, Sims & Coggins. For decades the business made work boots and then ventured into fabrics, clothing and sports goods.
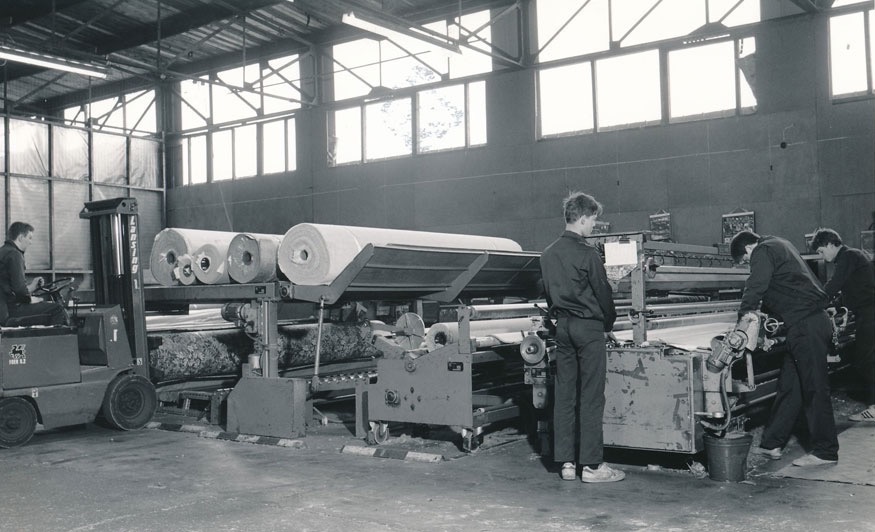
Sims & Coggins was dropped from the company name during 1989 and the business then focused on distributing floor coverings — carpet, laminate, vinyl and so on — from the early 1990s. (I did say this company was dull.)
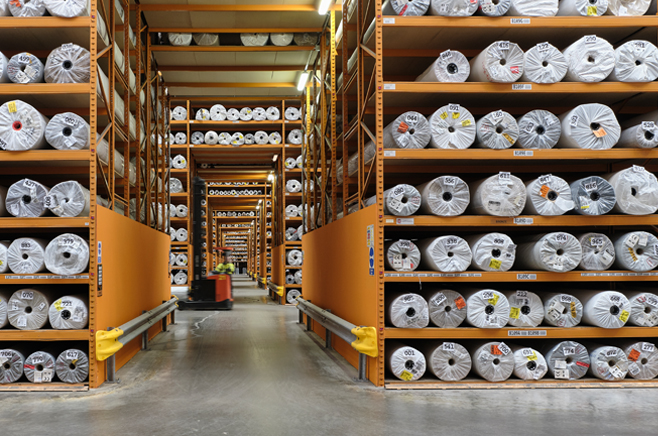
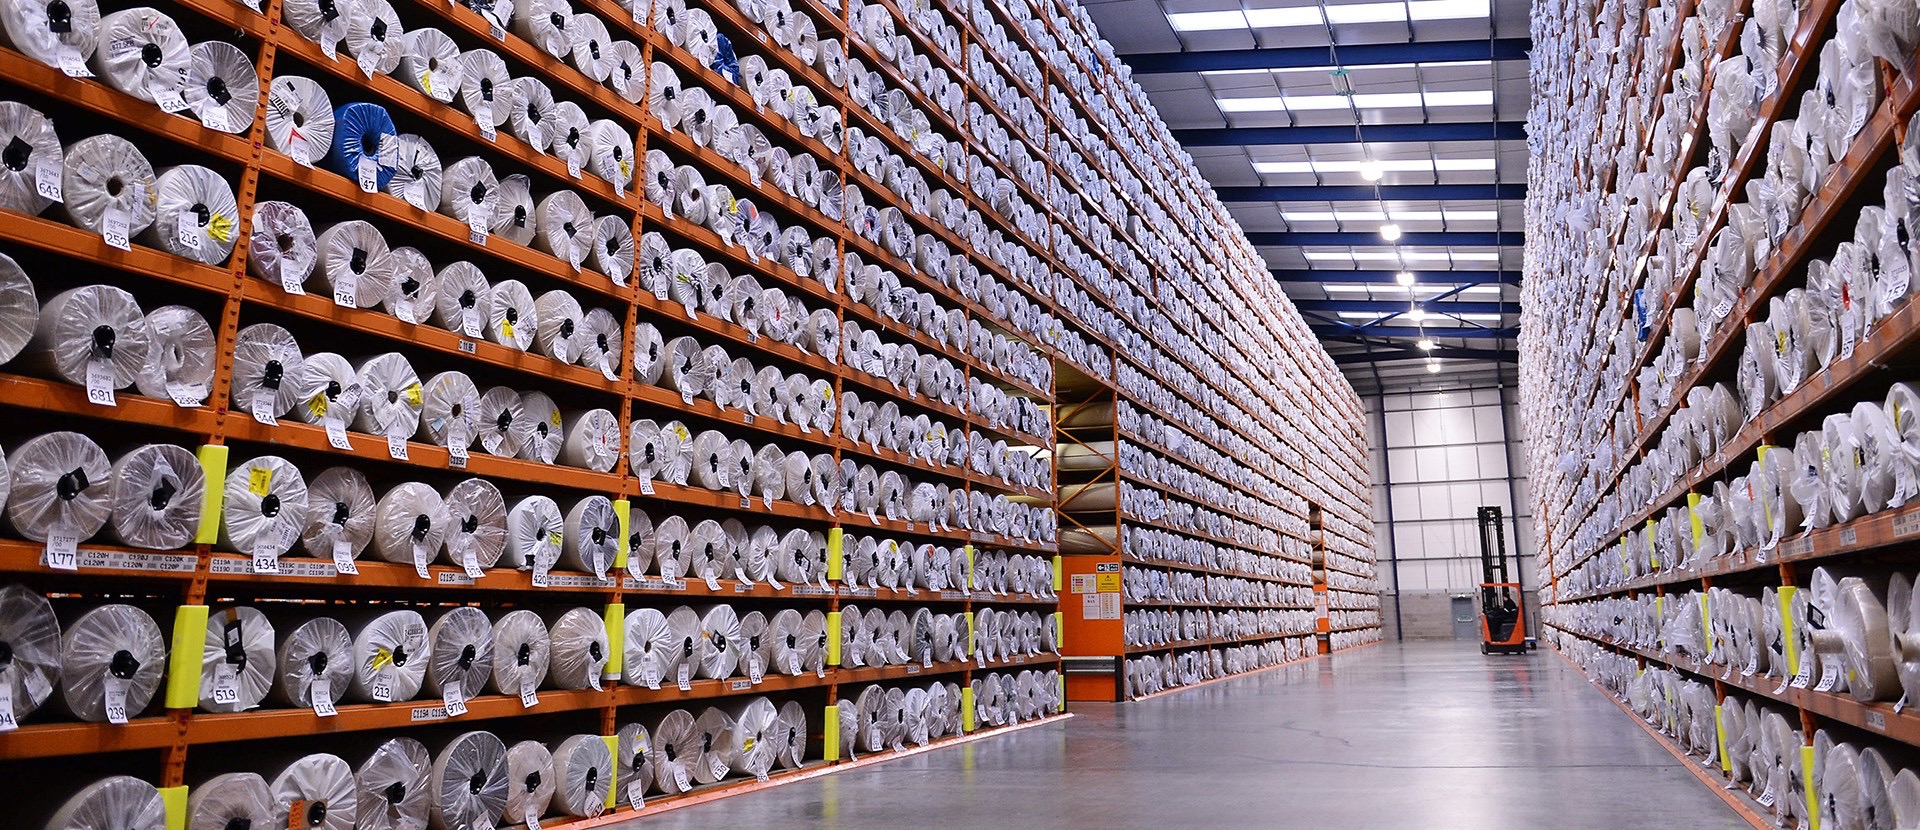
These days Headlam purchases more than 36,000 different lines of floorcovering from manufacturers in 19 countries to re-sell within the UK, France, Switzerland and the Netherlands. The business is the largest of its type in Europe.
Suppliers employ Headlam as an easy route into European markets while customers — mostly independent retailers and small contractors — enjoy a wide product range and ‘just in time’ delivery.
Headlam’s network of distribution hubs and warehouses last year handled 5.3 million orders placed by approximately 70,000 customer accounts.
Two-thirds of revenue relates to products for residential use, with the balance used within commercial buildings: 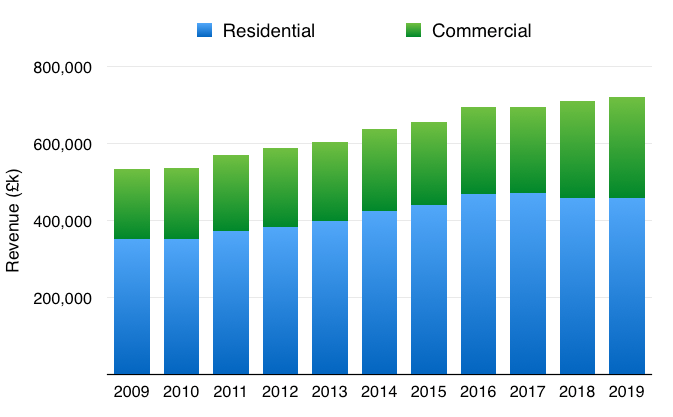
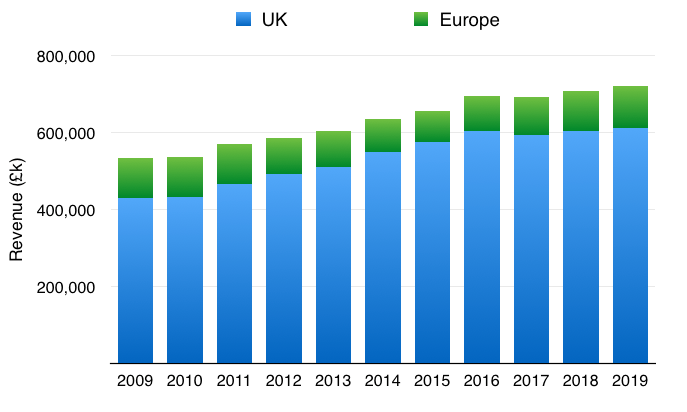
The majority of revenue (and almost all profit) is earned in the UK:
I presume demand for new carpets is correlated to the housing market and wider economy, and the aforementioned dividend cuts perhaps underline the firm’s cyclical nature.
SharePad’s Company tab reveals Headlam’s chief executive has been a director since 1991:
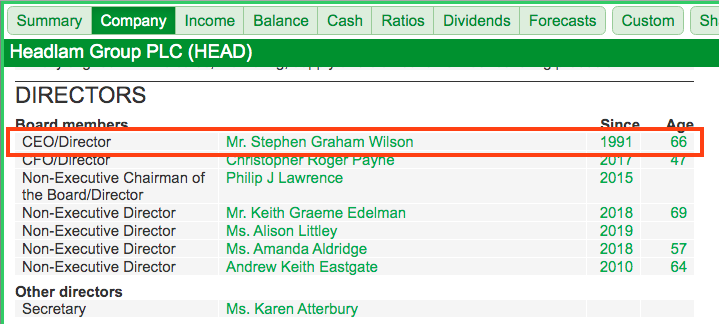
Mr Wilson was initially appointed finance director and took the top job during 2016. His long-term board experience, loyalty to the business and accounting background may well come in handy given Headlam’s Covid-19 predicament (more on that later).
Headlam’s SharePad Summary
The SharePad Summary for Headlam is shown below:
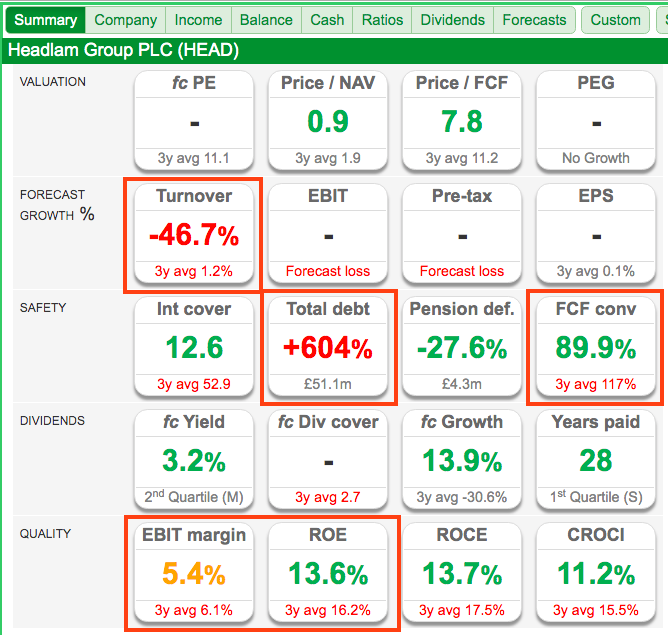
The following points interest me:
* The alarming 47% reduction to turnover expected for this year (second row);
* The sizeable increase to debt alongside robust cash conversion (third row), and;
* The lowly margin and modest return on equity (fifth row).
I’ll review the financials first and then get to that 47% revenue drop.
Debt and cash conversion
Headlam operated with a net cash position until last year:
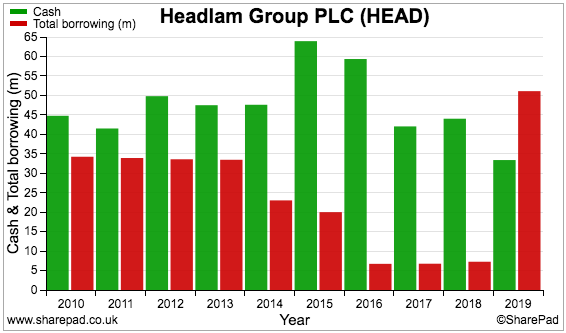
The large debt advance (red bars) look ominous, but SharePad’s Balance Sheet tab quickly reveals the movement is not sinister:
The new IFRS 16 accounting standard has brought operating lease obligations (such as lease agreements to occupy a property) onto the balance sheet, and now classifies them as borrowings.
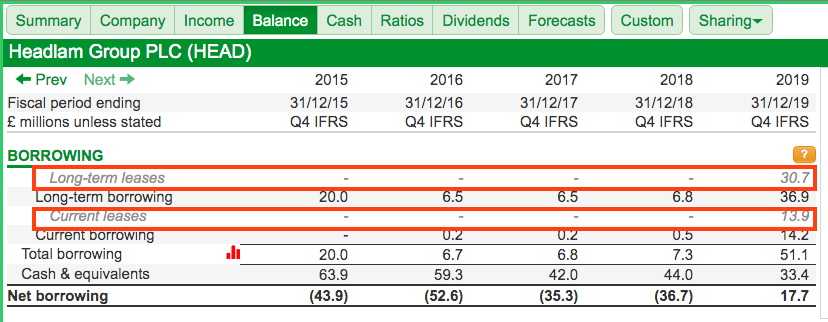
Headlam’s annual report confirms SharePad’s data. Companies are not mandated to restate their old accounts for IFRS 16, which gives the impression of a sudden debt increase:
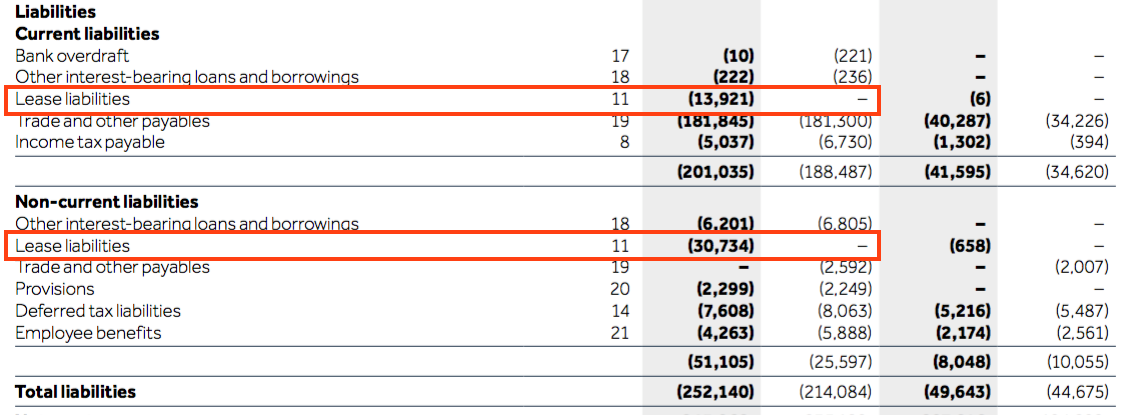
The annual report shows conventional borrowings of £6 million, which do not seem troublesome given cash was £33 million. (We can also deduce this £6 million figure from the earlier SharePad data by subtracting the IFRS 16 leases total of £45 million from the aggregate borrowings total of £51 million)
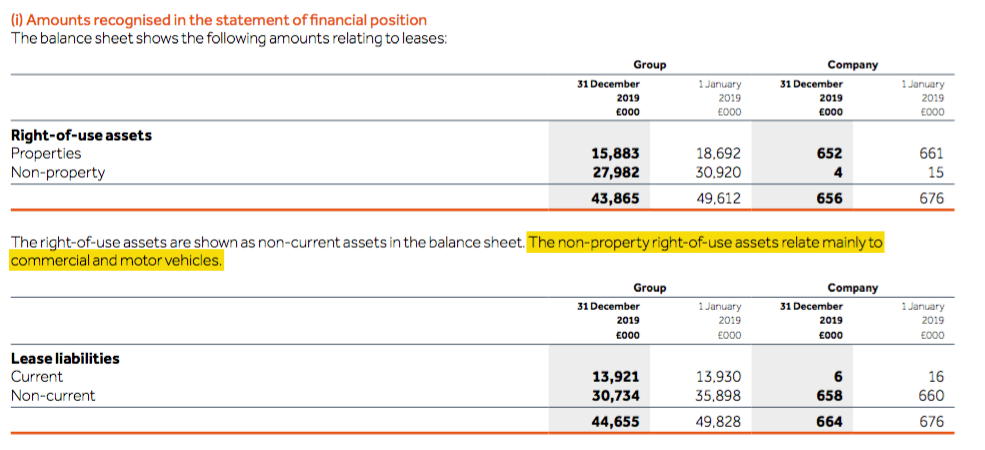
The annual report reveals the leases relate mostly to commercial and motor vehicles:
Headlam’s cash-conversion percentage (black line, right axis) has been very impressive:
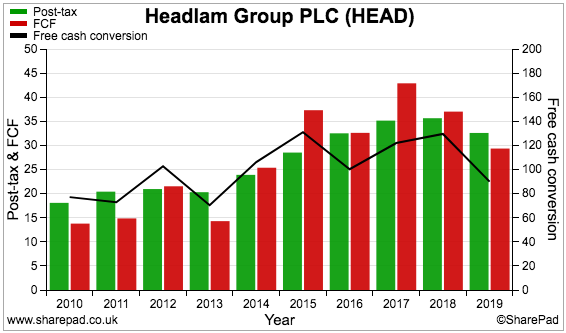
Last year’s 90% conversion rate was in fact the lowest since 2013. Between 2014 and 2018, the business amazingly converted at least 100% of its reported earnings into free cash.
This chart provides a clue as to what lies behind the outstanding cash conversion:
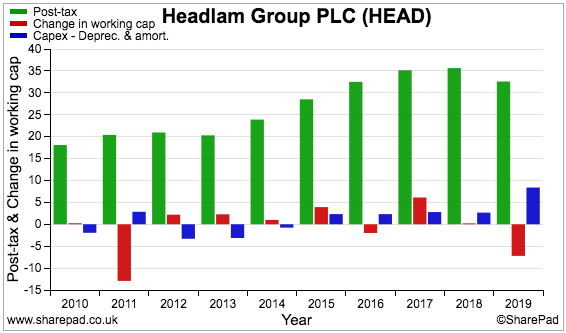
Headlam’s earnings (green bars) are compared to additional investment in working capital (red bars) and ‘excess’ capital expenditure (blue bars) — that is, the cash spent on tangible assets minus the associated depreciation expensed against earnings.
In Headlam’s case, the ‘excess’ capex isn’t actually excess at all. Those positive blue bars indicate the group’s depreciation charge is regularly greater than the cash spent on tangible assets.
This phenomenon is very unusual and means either Headlam:
* Underinvests in its assets, or;
* Applies very prudent depreciation accounting when determining its earnings.
The annual report is needed to discover what is going on. The relevant note is shown below:
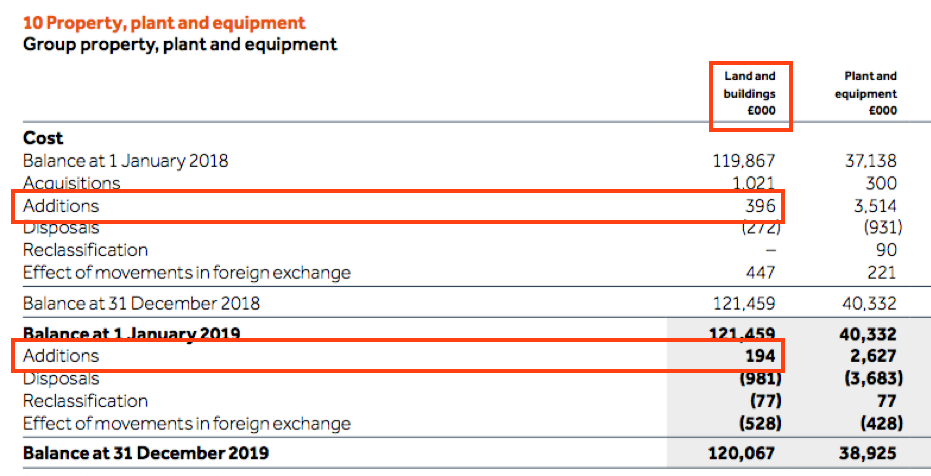
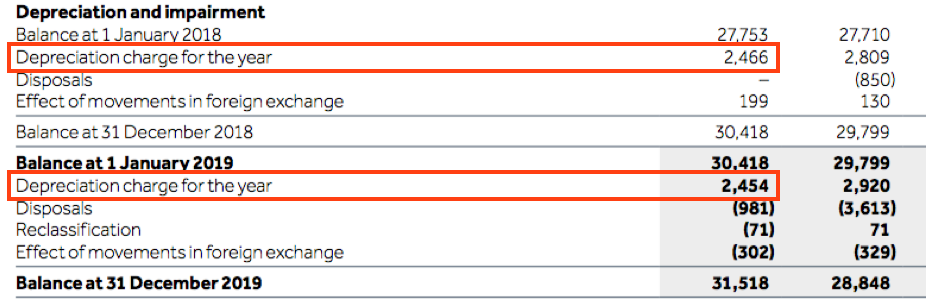
Headlam’s land and buildings explain the situation. During 2018 and 2019, the company spent a total £0.6 million on new properties — yet the combined deprecation charge was close to £5 million.
The annual report also reveals:
* 92% of land and buildings by book value are represented by freehold properties;
* Freeholds are depreciated at 2% a year, and;
* The properties are held at cost and may have a market value of £101 million versus an £80 million accounting value.
Headlam is gradually writing down the value of its freeholds, but appears not to spend much to keep the properties in good shape. Indeed, freehold property ought to at least hold its value over time rather than lose 2% a year as per Headlam’s depreciation policy. I can’t say Headlam is underinvesting in its assets and instead get the impression the accounting is very prudent.
Working capital and acquisitions
I highlighted this lovely chart during the SharePad webinar:
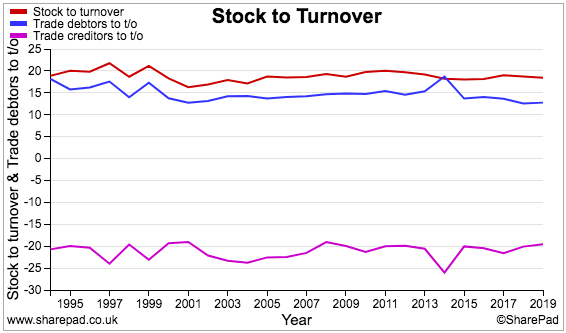
The lines represent stock (red), trade debtors (blue) and trade creditors (pink) as a proportion of revenue.
The 25-year consistency of the three lines reflects exceptional working-capital management — with the stability all the more impressive given the profit fluctuations. The above chart emphasises more than any other in this article that Headlam offers genuine operational quality.
Headlam has commendably used most of its free cash (green bars) to fund dividends (pink bars), which included special payments for 2015 and 2016:
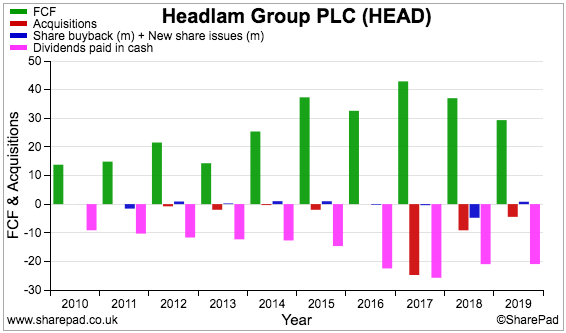
Acquisitions (red bars) have occurred during recent years and the 2019 results did imply further purchases could be expected:
“We continue to monitor a targeted pipeline of acquisitions in-line with our strategic objectives of achieving meaningful growing and a broadened presence in the wider industry, including through product categories and market segments, and remain receptive to further opportunities.”
The jury remains out on the strategy.
The group’s largest deal involved an initial £24 million spent acquiring Domus — the “UK’s leading specification consultant and supplier of hard surfaces for premium construction and refurbishment projects” — during 2017.
However, the 2019 results admitted the Domus purchase had not gone entirely to plan:
“The original contingent consideration relating to the [Domus] acquisition has now been fully released to the income statement as a non-underlying credit since the likelihood of achieving the EBITDA criteria required to trigger any contingent consideration payments is considered to be very low. Additionally, based on the Board’s assessment of the carrying value of the investment in the Domus business, a goodwill impairment of £2.1 million has been recognised within non-underlying items in the year.”
Headlam blamed a “predominant focus on larger scale projects within the London area” that was “adversely affected by the weak market backdrop and political and economic uncertainty…”
Domus does not seem to be a complete disaster, though, and future purchases may have been put on ice anyway due to the pandemic.
Margin and ROE
Headlam operates with single-digit margins, which typically implies the absence of a competitive ‘moat’:
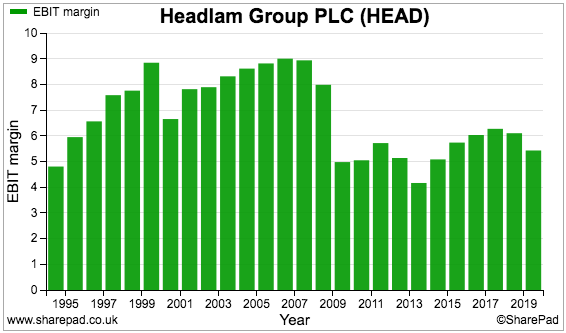
I suppose distributors can never make huge margins because the end customers would always cut out the middleman if they are able to buy a lot cheaper through going direct.
The above chart shows the profit margin dropping from 8% to 6% following the 2008/09 banking crash.
Checking Headlam’s gross margin — that is, the direct gain enjoyed on purchased supplier stock — shows a steady performance:
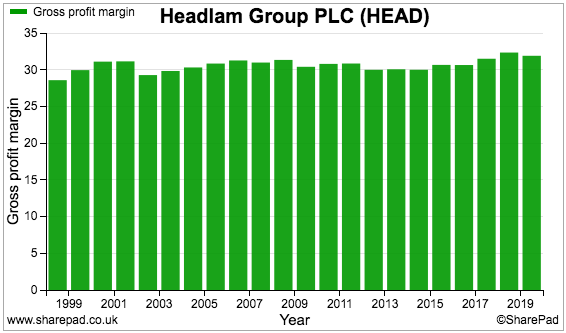
The post-2009 margin decline therefore seems due to greater indirect costs such as transport and/or administration.
Headlam’s ROE is not spectacular in the low-teens:
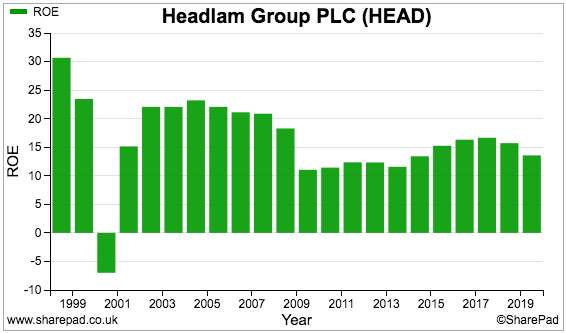
The saving grace here is the aforementioned freehold properties. Such assets tend not to generate superb returns but on the plus side should offer greater balance-sheet stability. Headlam’s land and buildings have typically represented 20% of total group assets.
Forecasts, latest updates and valuation
Now to the most pressing issue for Headlam and its shareholders.
The forecast 47% reduction to turnover reflects the Covid-19 impact on the business:
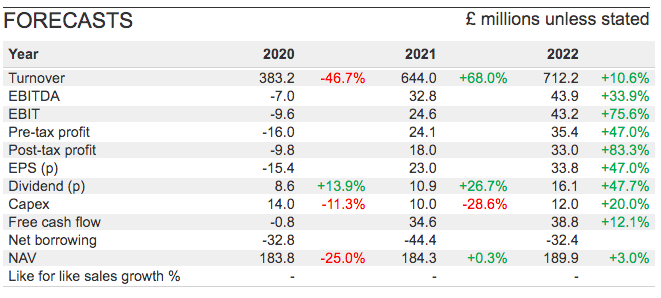
Losses are expected this year, and the City predictions suggest a full recovery will not occur until 2022. An AGM update during May revealed the early extent of the damage:
“In the UK, for the period since 25 March 2020, the Company has been operating at a level which, on average, equates to approximately 10.4% of internal revenue expectations. For the last five trading days, led by increasing demand, this has risen to approximately 28.8%.
80.5% of the Company’s UK workforce are currently furloughed, compared with 87.6% on 11 May 2020 as sites have reopened reflecting demand, and continue to be paid an enhanced form of the UK Government’s Coronavirus Job Retention Scheme.”
UK sales falling 90% certainly sounds bad.
Pandemic progress has been somewhat better in Europe:
“For the period since 25 March 2020, the Continental European businesses have collectively been operating at a level which, on average, equates to approximately 66.8% of internal revenue expectations. For the last five trading days, this has risen to approximately 75.5%, with the recent lessening of restrictions in France being a key driver.”
I have no idea whether the 2022 estimates will prove to be accurate. I dare say a full recovery could take a lot longer.
But remember the price chart — the shares traded at 550p just before Covid-19 struck:
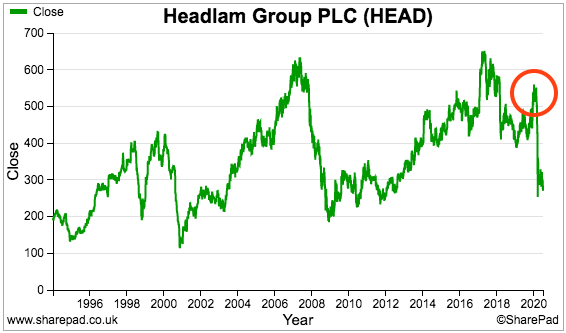
Even a five-year recovery back to 550p would deliver a useful 15% per annum return for anyone holding at the recent 270p.
The 550p share price then reflected a P/E of 14x, so the valuation was not exactly extended pre-Covid either.
Can Headlam recover? Certainly the cash on hand, low bank borrowings, significant freeholds and history of ace cash generation provide hope. Factor in past recoveries led by the veteran Mr Wilson, and the omens seem positive to me.
I would add that if Headlam is a market leader and sales had dropped 90%, how must its smaller rivals be faring? This business could well emerge from the pandemic with a much stronger industry position — and perhaps even a stronger share-price high.
Until next time, I wish you safe and healthy investing with SharePad.
Maynard Paton
Disclosure: Maynard does not own shares in Headlam.
This article is for educational purposes only. It is not a recommendation to buy or sell shares or other investments. Do your own research before buying or selling any investment or seek professional financial advice.


