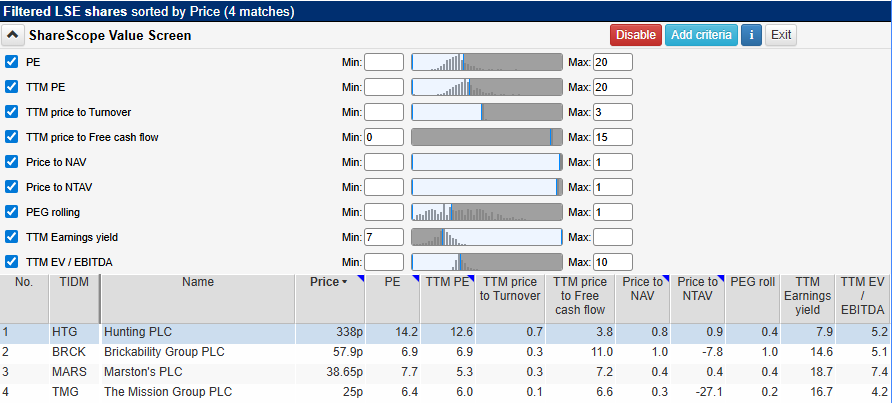
Looking to uncover undervalued opportunities with ShareScope? We’ve created this Value Stock Screening Guide to go with our off-the-shelf Value Screen to help you learn how to spot them. It’s designed to highlight the key signals we believe matter when searching for shares trading below their true worth.
ShareScope subscribers can apply this screen at the click of a button on the home page in ShareScope – click on the “house” icon near the top left of the program and then scroll down the home page to the Popular Stock Screen section.
Use it as a starting point: explore the logic, dig into the data, and then make the screen your own.
What Is a Value Stock?
A value stock is one that appears underpriced when compared to the true worth of its business. These companies are often overlooked by the market—but still financially solid and profitable. ShareScope’s Value Screen is designed to help you identify stocks trading at a discount, offering potential for capital appreciation without paying a premium.

Why we choose these criteria
✅ 1. Reasonable Price Relative to Earnings
- P/E Ratio ≤ 20
Compares the share price to the company’s earnings. Keeping it below 20 ensures the stock isn’t trading at an excessive multiple.
Jargon Lite Version: You’re paying no more than £20 for every £1 the company actually earned.
- Trailing 12-Month P/E ≤ 20
Based specifically on the most recent 12 months of reported earnings, so valuations are grounded in up-to-date results.
Jargon Lite Version: Looking at the last year’s profits, you’re not paying over the odds for what the business has already delivered.
✅ 2. Revenue Still Matters
- Price to Turnover (Sales) ≤ 3
Turnover refers to revenue or total sales. A low price-to-sales ratio indicates the market isn’t overvaluing each pound of sales.
Jargon Lite Version: For every £1 in sales, you’re paying £3 or less – keeping valuations sensible.
✅ 3. Cash Flow Awareness
- Price to Free Cash Flow ≥ 0 and ≤ 15
This filter ensures the company is generating positive free cash flow—actual money it can reinvest or return to shareholders—and not trading too high relative to that cash.
Jargon Lite Version: You’re paying no more than £15 for every £1 of genuine spare cash the business generates.
✅ 4. Asset-Based Value
- Price to Net Asset Value (P/NAV) ≤ 1
This ratio compares a company’s share price to the value of its assets minus liabilities. A value of 1 or less means the company may be worth more if broken up than its current market price suggests.
Jargon Lite Version: You’re buying the company for what its net assets are worth—or less.
- Price to Net Tangible Asset Value (P/NTAV) ≤ 1
This is even more conservative—it excludes intangible assets like goodwill or intellectual property.
Jargon Lite Version: If you strip away the non-physical assets, the company is still trading at or below the value of its real, tangible assets—factories, property, inventory, and so on.
✅ 5. Growth at a Fair Price
- PEG Rolling < 1
The PEG compares valuation (P/E) with expected growth. A value below 1 suggests the company’s growth prospects are undervalued.
Jargon Lite Version: You’re not paying over the odds for growth – the price looks cheap compared to expected earnings increases.
✅ 6. Attractive Earnings Yield
- Trailing 12-Month Earnings Yield > 7%
This flips the P/E ratio and shows how much earnings you get for your money. A yield above 7% indicates strong value.
Jargon Lite Version: For every £100 invested, you’re effectively earning £7 or more in company profits.
✅ 7. Reasonable Enterprise Valuation
- Trailing 12-Month EV/EBITDA < 10
Enterprise Value (EV) measures the company’s market value plus debt, minus cash. Dividing this by EBITDA (profits before interest, tax, depreciation, and amortisation) gives a fuller view of valuation. Below 10 is considered sensible.
Jargon Lite Version: Taking into account both debt and profits, the company is reasonably priced.
Who Is This For?
This screen is ideal for:
- Classic value investors
- Contrarian thinkers seeking undervalued gems
- Anyone wanting fundamentally sound businesses trading at sensible prices
Make It Your Own
Value investing thrives on careful selection. Use this screen as a base and:
- Add debt or dividend filters to reduce financial risk
- Combine with quality metrics (like ROCE or profit margins) to avoid value traps
- Tighten the P/E or price-to-cash-flow ranges depending on your sector or risk appetite
Learn More About Value Investing
Want to dive deeper into valuation metrics and how to spot under-the-radar opportunities? Explore Chapter 11 of our Step-by-Step Guide to Investing, which covers Benjamin Graham’s timeless principles, intrinsic value analysis, and real-world screening techniques.
Read Chapter 11 – Value Investing
We’d love to hear your take
Do these criteria reflect how you think about value? What would you adjust or add? Our version only turns up a handful of results on the LSE — what changes would you make to widen the net without sacrificing on quality? Share your thoughts in the comments – whether it’s feedback, suggestions, or your own strategies.
This article is for educational purposes only. It is not a recommendation to buy or sell shares or other investments. Do your own research before buying or selling any investment or seek professional financial advice.


Another excellent article in this series. Provides a firm basis for developing stock screens. A good compliment to the books by Phil Oakley and Algy Hall.
Great assistance with the Financials screen
Great assistance with theFinancials screen