
With markets in a volatile mood because of Trump Vs 2.0, in this month’s note on funds, we concentrate on income-producing fund ideas as well as funds that minimise market volatility by picking only those stocks with more defensive characteristics. We also outline an adventurous portfolio of high-yielding investment trusts and ponder whether UK small caps might be a valuable source of income opportunities. Oh, and if US equities are in a bear market – which they aren’t, yet – how much lower could the S&P 500 go?

Market snippets
Given the global gyrations, I thought I might start with some interesting market snippets. We’re probably midway through a profound macroeconomic regime shift, with huge global implications for the stock markets. Trying to make sense of these shifts is a nightmare, but some interesting data points are worth considering.
Let’s start with the obvious $64 trillion question: if US equities have gone off the boil (as measured by a benchmark like the S&P 500), how much further might US equities fall?
Strategists at Goldman Sachs have crunched the numbers on bull and bear markets: they reckon the average cyclical and event-driven market generally tends to fall around 30%. However, they differ in terms of duration. Cyclical bear markets last an average of around two years and take around five years to fully rebound to their starting point, while event-driven ones (which is what we’re probably experiencing now) tend to last around eight months and recover in about a year.

Next up, small cap equities as an asset class. Small caps have had a torrid few years, massively outperforming their large (and mega-large) cap peers, partly as a result of the tech boom and partly as a result of low interest rates. Traditionally investing in small and micro caps has rewarded investors with a premium for all that extra risk. But since 2015, that premium has vanished, especially in the UK, where small caps have massively underperformed what has been generally an underperforming market.
Now that interest rates seem to be staying higher for longer, and trade barriers are rising on a weekly basis, maybe some of the big structural, macroeconomic trends that favoured large caps and the Mag7 might be unwinding. If that’s the case might small caps be about to come back into favour?
One bright spot might be income – as share prices move up and down violently, the attractions of a regular income via dividends start to become more attractive. According to Octopus Investments’ bi-annual Dividend Barometer private investors should consider UK small and mid-cap companies for income.
For both 2025 and 2026, yields within the FTSE Small Cap Index and the FTSE 250 are expected to be above the FTSE 100. Yields in the FTSE Small Cap are expected to climb from 4.03% in 2025 to 4.41% in 2026. Meanwhile, dividend cover ratios across all growth indexes are forecast to surpass the FTSE 100 by 2026. When it comes to earnings growth potential, current forecast consensus estimates suggest that both the FTSE AIM index and the Deutsche Numis Smaller Companies Index are expected to deliver a compelling 22% compounded annual earnings growth for the two years to December 2025. This growth rate is comparable to the Nasdaq Composite, yet Nasdaq trades at around a 23.9x price-to-earnings multiple, whereas the FTSE AIM and Deutsche Numis UK Smaller Companies Index trade at far lower multiples – around 13x and 10.8x, respectively. Octopus reckons this valuation gap presents an interesting opportunity: investors looking outside of the FTSE 100 for equity income can benefit from a growing dividend stream with the potential for material share price recovery as the market adjusts.
Sticking with that dividend income theme, investment trusts that pay a regular dividend might also be looked on more favourably—there’s a long tail of deeply discounted trusts that have a long track record of paying generous dividends, based in part on strong cashflows and built-up shareholder reserves (which allow investors to smooth out the payout).
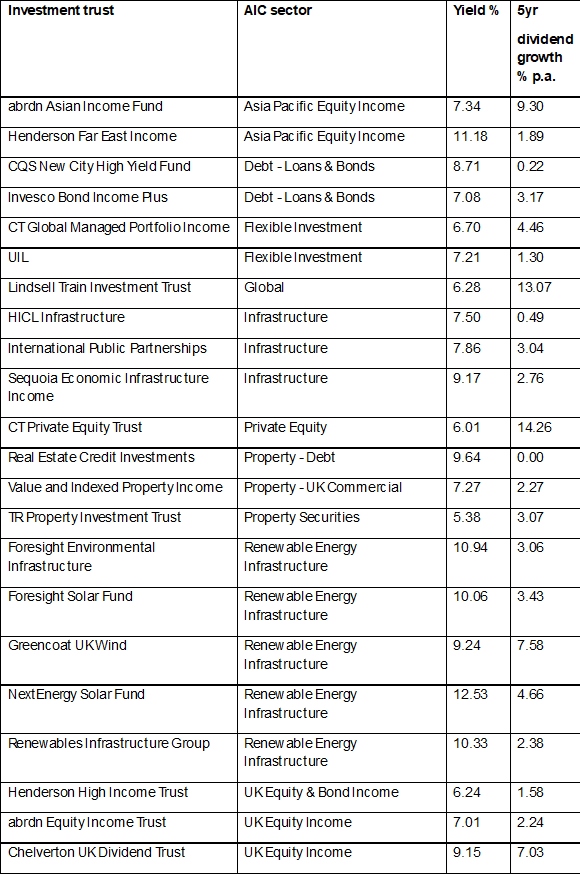
The Association of Investment Companies (AIC) has just released a useful list of 26 investment trusts that pay a yield of more than 5% and have not cut a dividend in the past ten years. That includes five trusts from the Renewable Energy Infrastructure sector, with yields ranging from 9.2% to 12.5%
Consistent income payers with yields of more than 5%
Low-volatility funds are providing respite
The focus on dividend income reflects an obvious truth – share prices might shoot up and down, but dividend cheques tend to pay out a stable amount. We’ll come back to that income point shortly, but what about the volatile share price bit of the equation? Is it possible to dial down the share price volatility by investing in shares through a fund like an exchange-traded fund (ETF) that only invests in more defensive, less volatile stocks? The answer is yes, and much of the time it’s a very successful wealth preservation strategy.
A good few years back, there was a sudden eruption of interest in what was called smart beta strategies. It sounds complicated, but it isn’t. Essentially, it’s saying you have two ways of passively tracking the (stock) market. The first is to buy into a tracker following a major index like the S&P 500 and be done with it!
The alternative is to say that the crowd, and thus markets, are not always perfectly efficient and that at some points, the market overindulges some trends (positive momentum stocks) and ignores others (value stocks). This gives rise to various market anomalies, as they are called, which range from value stocks through quality stocks to low-volatility strategies. These strategies all involve using technical and fundamental metrics to spot stocks that might be underappreciated and priced inaccurately by the market.
Low or minimum volatility has always looked the most interesting of all the strategies based on anomalies (you are paid extra for taking on a riskier strategy that isn’t just buying the market).
In simple terms – and it is quite simple – one looks for liquid stocks (usually larger caps) that boast less volatile stock prices and acquires them.
You won’t always beat positive momentum stocks in up markets, but you will probably outperform them in down markets. A fair amount of complicated academic work buttresses this strategy, but that’s the core message: for cautious defensive equity investors, low or minimum-volatility strategies can make sense.
The current market turmoil appears to support this conclusion. I’d cite a cracking little note called Expectations and Anomalies by Joseph Nelesen, Head of Specialists, Index Investment Strategy, S&P Dow Jones Indices.
As the graphic below shows, a low-volatility version of the S&P 500 has recently outperformed the ‘mainstream’ S&P 500.
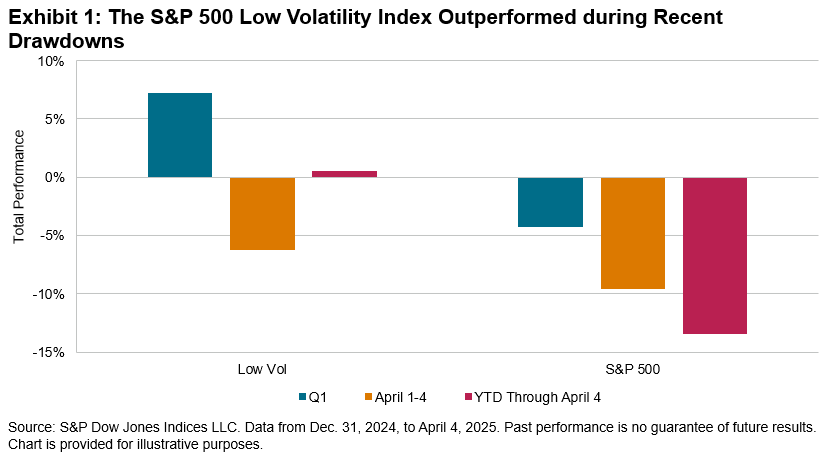
According to Nelesen at S&P Dow Jones, this isn’t unusual; “Low Vol has a track record of losing less, while still participating in upside, in a pattern often referred to as the “low volatility anomaly.” Researchers call this factor’s performance an anomaly since it defies conventional economic theory about the positive relationship between return and risk. Explanations for this breakdown in the risk/return relationship centre around mispricing (more precisely, underpricing) of lower-risk stocks and overpricing of higher-risk stocks due to a mix of behavioural, structural and economic drivers.
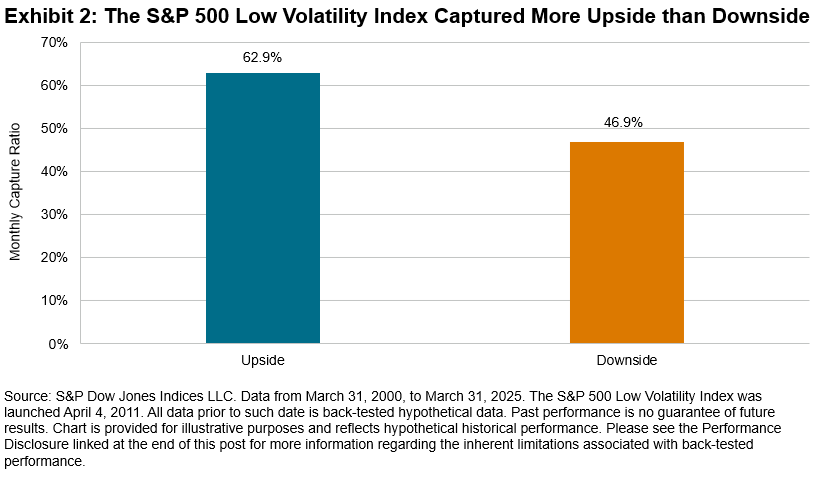
Nelesen reckons that the Low Vol index has historically delivered less risk than the S&P 500, with an annualized volatility of 11.6% compared to 15.3% for the 500™ and a lower beta (0.7) over the 25 years ending March 2025. Lower volatility and beta come from capturing less of the ups and downs of market movers, but in the case of Low Vol, this rate of capture is not symmetrical. Looking again at the 25-year period ending in March 2025, he calculated monthly upside and downside capture ratios for Low Vol relative to The 500, as shown in Exhibit 2.1
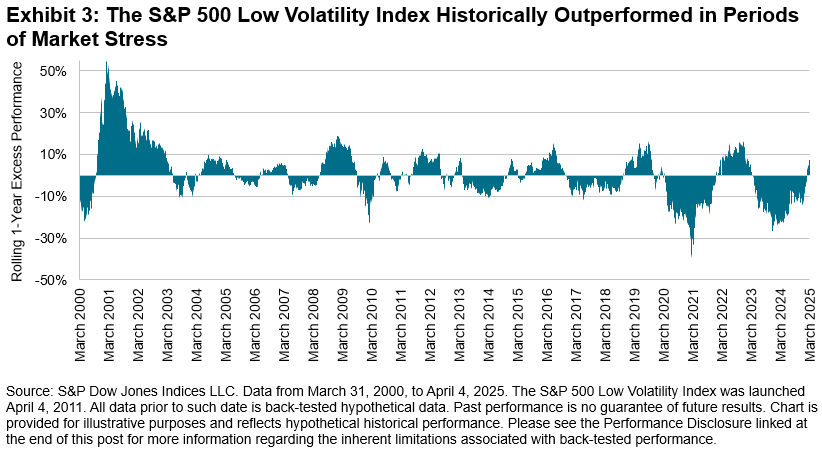
The observed upside and downside capture characteristics of Low Vol have played out in real-time to various degrees of magnitude through expansions and downturns over the last 25 years. In recent months, the factor has shown relative resilience again, as illustrated by Exhibit 3’s chart showing rolling one-year excess performance versus The 500.
The good news is that it is possible to easily buy into exchange-traded funds that track these minimum or low-volatility indices. The table below features the ETFs available in the UK market, with iShares dominating the list. UBS offers the cheapest ETF at 0.18%, which is only slightly lower than the iShares Edge product at 0.20%. However, the UBS product replicates the index through physical replication, mirroring the actual holdings as closely as possible, while optimisation serves as an approximation of the underlying index.
One last point on returns: In the table below, I have compared the US dollar returns for iShares’ huge S&P 500 ETF (plain vanilla EEFT with a TER of just 0.07%) and the US dollar version of the minimum volatility strategy (ticker SPMV – the ticker in the table above is the sterling version). As you might expect, the mainstream, plain vanilla S&P 500 has outperformed over the long term, but the minimum-vol version has still yielded a decent return over the long term.
| Period through to 31st March 2025 | CSPX S&P 500 ETF accumulation units | SPMV Edge S&P 500 Minimum Vol accumulation units |
| YTD | -4.33% | 2.48% |
| 1 year | 7.97% | 11.05% |
| 5 year | 131% | 97% |
| 10 year | 214% | 168% |
Income funds
My core contention for some time has been that UK interest rates are too high. They are punitive, with positive real rates well over the inflation rate. This might be necessary if the UK economy was expanding too fast, but we are far from that happy outcome, with the GDP growth rate well under the long-term average.
We’ve seen UK interest rates come down by a smidgeon, but they could still go a lot lower if inflation fears started receding. That might be a growing possibility post-Trump and his tariffs. However we look at it, the immediate impact of these tariffs on the UK economy will be contractionary, i.e., there’s a chance we could experience a slowdown in growth. Gas prices are also decreasing (a significant issue for UK energy prices) and most businesses have rammed through any price increases they had planned after the increase in labour costs (courtesy of the NI changes).
Crucially, Five-year swap rates—a key metric used by mortgage companies—have started to edge lower and currently stand at around 3.7%. UK 2-year gilt yields have also recently pushed below 4%, though they are now a tad above that level again.
I believe the chances of UK interest rates dropping to 4% or lower more than twice have significantly increased—I would now estimate that probability to be above 50%. If this is the case, it’s reasonable to expect the 5-year swap rate to decrease significantly to around 3%, and the UK 2-year gilt rate to approach 3.5%.
Many investors will intensify their search for income-based investments at these levels, with most attention on UK alternative investment trusts. Because of a massive sell-off in these alternative funds, yields of well more than 8% are very common. That implies that if UK 2-year gilts fall below a 3.5% yield, a portfolio of carefully chosen alternative funds could provide an excess yield of over 5%, i.e. 8.5% minus 3.5%. Crucially, many of these funds are now trading at discounts well in excess of their medium-term average.
Cue the table below, which maps out a model alternative portfolio of five alternative income funds, all of which, in effect, lend money to other businesses. Each of these funds – bar CQS New City High Yield – invests in slightly complex transactions, be they asset-backed securities or infrastructure loans. As an aside CQS invests in relatively simple-to-understand corporate bonds with a higher yield – see below. That makes these funds difficult for most investors to understand, but I think these five funds look compelling for adventurous types. However, some, such as Sequoia and BioPharma, are more compelling than others.
I suggest these fine funds only as a starting point for research, but below I’ve added a quick pen portrait summary of each fund. The usual caveats apply: these funds are complex, pricing can be volatile, bid-offer spreads can be wide and you need to be adventurous enough to do your own research. Most of the funds also trade at chunky discounts to their net asset value.
TwentyFour Income. This well-established, decent-sized fund invests in asset-backed, mortgage-related securities. Its track record is solid if unspectacular, churning out an annualised 8% return since inception, and its yield is a sustainable 9.3%. It recently declared its final dividend of 5.07p, bringing the total for the year to 11.07p (FY24: 9.96p), a record balance and full-year dividend. The company currently pays shareholders 2 pence/quarter, in line with its target for the year, with the final balancing dividend announced after the 31 March year-end. So, what does TwentyFour Income invest in? In straightforward terms, this London-listed fund targets less liquid, higher-yielding UK and European asset-backed securities (ABS). This part of the fixed-income market remains largely overlooked, and fund managers believe it represents attractive relative value.
BioPharma Credit. A truly unusual fund, but one with an excellent track record – and big enough to provide real liquidity for investors. BioPharma lends money mostly to publicly listed life sciences businesses struggling to raise equity funding (pretty much all listed biotechs struggle to raise equity capital) to help fund obvious growth opportunities i.e launching a new suite of drugs or medical products. BioPharma lends the money at decent rates – nearly always in the double digits and then sits senior in the capital structure. Crucially, though it has a fantastic track record of getting its money back – too many loan funds have sunk because of high default rates. Many of BioPharma’s borrowers, by contrast, pay the money back early, because of a takeover. That triggers early repayment fees, which add to the total return. It also helps that BioPharma has a very active discount control mechanism designed to get a discount below 5% as quickly as possible.
CQS New City High Yield. Managed by Ian ‘Marco’ Francis at CQS, this corporate bond fund has a long track record and a very loyal fan base amongst wealth managers. Like its nearest peer Invesco Bond Income Plus, it buys into higher-yielding corporate bonds but is careful about what it buys. Ian has a focus on providing investors with a high dividend yield, achieved through a diversified portfolio of 140 holdings predominately in high yield. Fixed Income represents 75% of assets, with 25% in Convertibles, Equities and Preference shares. Helpfully the fund has traded either at par or at a premium for much of its life.
Fair Oaks Income. This investment is more for experienced investors who understand structured finance, particularly collateralised loan obligations (CLOS). Fair Oaks focuses on debt structures where the riskiest layer, equity, is positioned below a series of risk-rated loans, starting with the safest AAA-rated loans. That sounds risky and in a deep recession it might well prove to be, but because the manager frequently sponsors and manages the pool of loans via a CLO, it understands the risk profile of the borrowers very well. And to date, its returns have been very impressive. Declining interest rates, perhaps because of a slowdown, could be a double-edged sword. It could lower the risk of defaults and prompt more refinancing. Still, it could also imply an impending recession in which those defaults (currently very low) could erupt into a financial crisis. But to date, Fair Oaks has navigated higher rates for a longer environment very well, and this is a hugely popular fund with many wealth managers.
Sequoia Economic Infrastructure. This lending fund invests in infrastructure debt. SEQI’s portfolio is invested across 54 private debt investments (91% of the portfolio) and five infrastructure bonds. 60% of the portfolio comprises senior secured loans, and the portfolio has an annualised YTM of 9.87%, alongside a cash yield of 7.29% (excluding deposits). The weighted average portfolio life is 3.4 years, and the manager reckons that the short duration means that SEQI can take advantage of higher yields in the current rate environment. A few loans have defaulted, which has caused the share price to fall quite a bit in recent weeks – the shares currently trade on a c.17% discount, yielding 9.0%. Wealth managers widely hold the fund and it boasts a very active approach to portfolio valuation, with monthly third-party valuations. I sense that there’s limited downside given the fund’s active buyback policy.

~
David Stevenson
Got some thoughts on this week’s article from David? Share these in the SharePad chat. Login to SharePad – click on the chat icon in the top right – select or search for ‘share chat’.
This article is for educational purposes only. It is not a recommendation to buy or sell shares or other investments. Do your own research before buying or selling any investment or seek professional financial advice.


