Global stock market indices are widely used benchmarks and also form the core of a huge and growing range of exchange-traded funds. But what are the differences between these various indices? Taking that idea of global equities in one fund, Wisdom Tree has just issued what I think is a cracking one-fund solution, an ETF that could easily serve as a core portfolio solution. Plus I also take a quick look at what Scottish Mortgage has been buying.

Global Equity Indices in detail
This month, I thought I’d indulge my pointy-head tendencies and explore what is arguably the most critical measure of global stock market performance: global equity (stocks and shares) indices.
Why do I say it’s so important? Because indices such as the MSCI World of the FTSE Emerging Markets index are used as default benchmarks not only by exchange-traded funds or ETFs but also by active fund managers. They’re also relied on by pension fund managers and long-term savings plan providers. These indices form the beating, throbbing heart of returns measurement for any long-term investment plan.
In sum, global equity indices like the MSCI World Index really, really matter.
On paper, there shouldn’t be too much variation between these global indices, as they all aim to capture roughly the same ‘thing’ – the ups and downs of major listed global equities. However, as we’ll discover, these indices vary enormously, ranging from obvious differences between, say, plain vanilla indices and emerging markets indices, arguably which you’d expect, all the way to the way through to differences between plain vanilla indices, which should, on paper, be virtually synchronised.
To understand these variations, I’ve looked at yearly returns for a collection of major indices, including the prominent global plain vanilla indices, factor versions, and two emerging market variations.
The short summary is that over the last decade, you almost certainly would not have wanted to be in most global factor indices or global emerging markets indices. By contrast, you would have wanted to be in more concentrated, US-focused indices and plain vanilla. None of that should come as a surprise. Still, as an aside, if mean reversion has any predictive value moving forward (which it may not), then history teaches that the dogs of yesterday quite frequently end up being the Kennel Club star mutts of tomorrow.
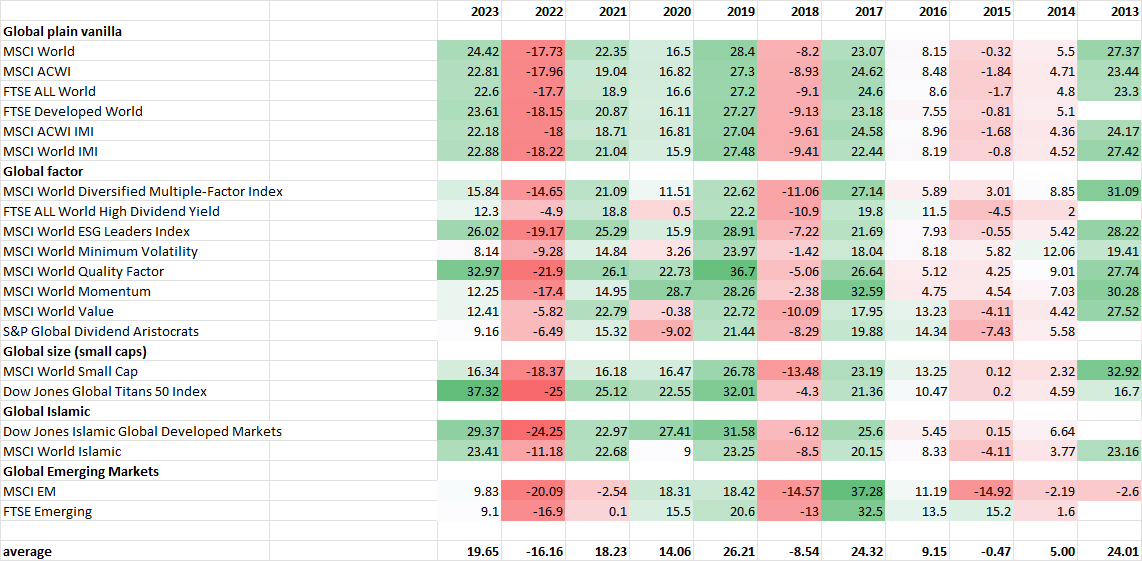
So, let’s kick off with the table below. This first table looks at yearly returns for a range of global indices.
2023 is a fairly typical, positive momentum year for global equities. Amongst the main plain vanilla indices used by most ETFs – and fund managers – there were small but noticeable return variations. The MSCI World index returned the most with 24.42%, while the MSCI IMI index returned 22.18%. Two per cent variation in returns doesn’t seem great, but it’s not nothing either. The same is true for a typically bearish, negative year – 2022. The MSCI World index lost the least at 17.73%, whereas the FTSE Developed World index (used by Vanguard) lost 18.15%, a difference of around 0.5% in one year.
The next point is a seismic return difference in factor-based indices. Factors can range from value to momentum, and factor indices have become very popular with institutional investors. In 2023, the MSCI World Quality factor was a star performer, producing a gain of nearly 33%, well in excess of the MSCI World plain vanilla index. By contrast, the supposedly boring minimum volatility version returned just 8.14%.
Arguably, the factor that made the most difference was the size factor. I have included two drastically different indices – the World Small Cap Index, which has been underperforming its plain vanilla peers for most of the last few years, and the mega large cap Global Titans Index from Dow Jones. This index, which comprises the top 50 corporates globally (a very concentrated index), has been a huge outperformer in the last few years largely because it’s over-invested in the very largest tech leviathans from America. I also think that returns from the two Islamic indices highlighted—the MSCI Islamic and DJ Islamic Developed Markets index—have been impressive.
One last general observation on emerging markets indices—I’ve featured two versions, the most popular one from MSCI and the FTSE EM index. I’m struck by the difference in returns over the years—there’s regularly a two per cent difference in returns most years between these seemingly very similar indices.
The next chart below looks at a smaller collection of the main global indices and digs a bit deeper at the technical level – I’d suggest focussing on the last two columns on the right. The Sharpe ratio over the last five years (with a risk-free return metric included) is a way of looking at the risk-free return over an extended period, incorporating risk and variability. Fundamentally, the more positive the number, the better the return. There isn’t a huge variation between the major plain vanilla global indices but I would point out that the ACWI index from MSCI scored just 0.036 while the FTSE Developed Markets index was at 0.041. Moving away from the plain vanilla indices, you’ll also notice that both the emerging markets and small-cap indices have drastically lower positive returns.
I would also highlight the volatility measure for daily returns over the last five years. Again, there is significant variation- as you’d expect, the EM and small-cap indices have been much more volatile, while the FTSE Developed markets index has boasted the lowest volatility.
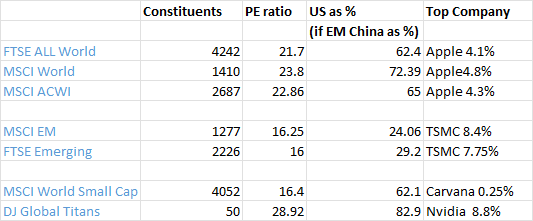
The last table below digs even deeper into what’s inside the main global indices – split into three groups: plan vanilla global indices, EM indices and size-based indices (Small cap vs the top 50).
Let’s start with the plain vanilla indices: the FTSE All World index has 4242 stocks vs. just 1410 stocks for the MSCI World index. The price-to-earnings ratios also vary—from 23.8 for the MSCI World to 21.7 for the FTSE All World. The concentration on US equities is also worth noting, which hits 72% in the MSCI World index compared to ‘just’ 62% in the FTSE All World.
Of all the indices in this table above, the stand-out exception is the Dow Jones Global Titans 50 index, which has just….50…stocks and a US exposure of over 80%. But that heavy concentration on just a small group of stocks has paid off handsomely in recent years.
The bottom line?
The single greatest driver of equity markets over the last ten years through to 2023 has been US mega large-cap stocks with an obvious tech bias. They are now a concentrated part of most investors’ portfolios, deservedly so because of their operating margins and cash generation. That huge driver helps explain why the Global Titans 50 index has been such a star recently – annoyingly, there’s no UK ETF that tracks this index, although iShares does offer one in Germany.
If you think that the US domination will continue – and I think that is likely for the short to medium term – then the most efficient index outside the Titans 50 index is the MSCI World index, followed by the FTSE Developed Markets index. The MSCI ACWI index contains the MSCI World but then adds emerging markets such as China – that’s been a distinct disadvantage in recent years. Still, if you want maximum global diversification, then the MSCI ACWI index is the one for you.
If you want a more focused basket of stocks based around a screen of fundamental criteria, then based on past performance metrics, I’d go for the MSCI World Quality Factor Index. This has 295 stocks with the top five holdings, all of which are very well-known US mega large-cap names: Nvidia (4.27%), Apple (5.7%), Meta (5.54%), Microsoft (4.7%) and Lilly Eli (3.21%). In sector terms, IT is at 32% and healthcare at 17%, while in terms of geography, the US is at 75% and Switzerland at 5%.
If you believe in mean reversion and feel a bit contrarian, then you should probably run as far away from the main global indices as possible – they all have clear US, tech stock, growth stock, and concentration bias. If the next ten years are completely different, then maybe emerging markets will shine (possible in my book), and value stocks and minimum volatility stocks – both available as MSCI World Factor versions – might also do well (less likely but still possible in my view).
Looking at exchange-traded funds that track these indices, I’d suggest the following very simplified shortlist of funds that are available via most broking platforms: I’ve broken them into two categories, cheapest and biggest (and most liquid).
| Index | Biggest and most liquid ETF | Cheapest ETF |
| FTSE ALL World | Vanguard FTSEALL World, ticker VWRD, TER 0.22% | Invesco FTSE ALL world, Ticker FWRA, TER 0.15% |
| MSCI World | iShares Core MSCI World ticker IWDA TER 0.20% | UBS MSCI World ticker WRDD TER 0.10% |
| MSCI ACWI | iShares MSCI ACWI, ticker ISAC, TER 0.20% | SPDR State Street ACWI, Ticker ACWD, TER 0.12% |
| MSCI EM | iShares Core MSCI EM, ticker EIMI, TER 0.18% | Amundi MSCI EM, ticker LEMIA, TER 0.14% |
| FTSE Emerging | Vanguard FTSE Emerging Markets, Ticker VDEM, TER 0.22% | |
| MSCI World Small Cap | iShares MSCI World Small Cap, Ticker WSML, TER 0.35% | HSBC MSCI World Small Cap, Ticker HWSC, TER 0.25% |
An ETF for all seasons
I write a fair bit about exchange-traded funds or ETFs in these articles, and barely a week goes by without some new issue that warrants attention. Slightly annoyingly, the vast majority of these ETFs are what I call investment tools, i.e., they are designed to be used as a tool for a particular idea, strategy, or asset class. They tend not to be portfolio solutions, by which I mean a one-size-fits-all fund that can act as its own core solution.
That’s changing slowly as ETF issuers begin to prioritise private investors rather than institutional investors. They’ve begun to realise that private types quite like the idea of a single fund for, say, global equities or global bonds, or better, equities and bonds. Ideally, the fund would be cheap, well-diversified, and quite ‘clever, ‘ which means it offers investors some novel features that make sense.
We’ve already examined global equity indices and some exchange-traded funds that track them. At their simplest, these index funds are hugely popular because they offer core portfolio solutions: cheap, easy to trade, and well-diversified. However, ETF product issuers still need to do more, especially in managing downside risk and providing a mix of equities and bonds in one fund.
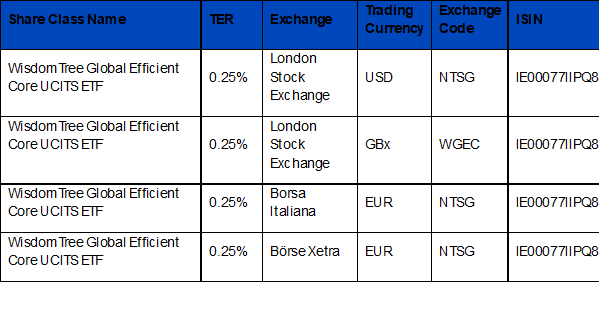
This is where a range of new ETFs from an issuer called Wisdom Tree comes in. They’ve just launched a gaggle of ETFs around a core WisdomTree Global Efficient Core UCITS ETF (NTSG). Here’s the blurb on the fund:
“NTSG, seeks to track the price and yield performance, before fees and expenses, of the WisdomTree Global Efficient Core Index (the “Index”) and has a Total Expense Ratio (TER) of 0.25%. NTSG, listed today on Börse Xetra and Borsa Italiana, and will list on the London Stock Exchange on 13 November 2024.
“ The index is designed to deliver a 90% exposure to large-cap global developed equities and 60% to global government bond futures, effectively providing a leveraged, more capital efficient alternative to the traditional 60/40 portfolio. The ETF invests 90% of its assets in a diversified basket of large-cap companies, that meet WisdomTree’s ESG (environmental, social and governance) criteria. To help magnify the benefits of the asset allocation, a 60% exposure to global government bond futures is then overlaid on top, using the remaining 10% of the portfolio as cash collateral for the futures. The futures portfolio consists of US, German, UK and Japanese government bond futures contracts with maturities ranging from two to 30 years. The exposures are rebalanced quarterly”.
“The strategy behind WisdomTree’s Efficient Core ETF range is grounded in academia and based on modern portfolio theory. Academics have long argued that the optimal portfolio for a given level of risk is a leveraged version of the portfolio that presents the best Sharpe ratio. By leveraging a traditional 60/40 portfolio, investors can receive a similar level of volatility present in a portfolio 100% allocated to equities but with the better Sharpe ratio of a 60/40 portfolio.”
Investment geeks might look at this and say “I know this strategy, isn’t this what LDI-oriented pension funds do ?”. They give cheap exposure to growth assets and then overlay bond exposure, not through direct holdings but through (leveraged) options and futures. And you’d be right. But that doesn’t mean it’s a bad idea – in very simple terms, it’s a form of the barbell approach, i.e. significant exposure to risk assets balanced by some lower risk, asset class exposure.
Another positive feature is the cost—at 25 basis points, this is a cheap product, though you could get cheaper if you mixed and matched dirt-cheap global equity trackers with global bond funds.
A few other features worth noting.
1. There’s an ESG screen which personally I’m not enthusiastic about and would rather they hadn’t included!
2. The index it tracks is not a widely used one: it’s called the WisdomTree Global Efficient Core Index.
3. In portfolio terms the ETF is comprised of three key exposures: Equity exposure: 90% invested in a diversified ESG-screened basket of globally developed large-cap stocks; Bond exposure: 60% in a diversified basket of government bond futures contracts, ranging from two- to 30-year maturities and across four currencies (USD, EUR, GBP and JPY); Cash collateral: 10% cash, serving as collateral for Treasury futures contracts. The futures portfolio comprises three US Treasury contracts, three EUR government bond futures contracts, one GBP government bond futures contract and one JPY government bond futures contracts
4. The equities are physically owned
5. There’s a UK sterling version of the fund with the ticker WGEC
My Bottom Line? I rate this product highly and think it is a real game-changer. It’s cheap, it gives good diversification in a simple-to-understand product and it can be easily traded. I can absolutely see this as a core product for many investors who don’t want all the choice and noise of working out messy asset classes, ETFs vs investment trusts etc, etc….
Wisdom Tree has a great explainer on their website HERE which I recommend reading before digging any deeper into the product. I see this as a passive rival to both multi-asset funds from the likes of Capital Gearing and Troy, as well as a dirt-cheap alternative to online robo-investing platforms. Buy this on a cheap investment platform (offering fees of say 25 basis points) and you have a single stock and bond solution costing you 50 basis points in total (25 basis points for the fund, 25 basis points for the platform). Great value!
Scottish Mortgage has been busy
Jefferies fund analyst Matt Hose reports on the giant UK investment trusts’ H1 numbers. The NAV per share (with debt at fair) increased by 1.9% over the half-year to 30/09/24, against a 3.6% total return from the FTSE All-World Index (£). Following the period-end, the NAV has increased by 6.5%, against an increase of 4.3% from the index. The shares currently trade on a 9.9% estimated discount to NAV.
Most interesting for me were the new positions and trading activity: “ During the half, SMT initiated a position in Latin American digital bank Nu Holdings, as well as French luxury goods company Hermes International. It also exited several small holdings where the growth outlook had changed, such as HelloFresh, Zolando and Zoom. The position in ASML was reduced while initiating a new position in close partner TSMC.”
~
David Stevenson
Got some thoughts on this week’s article from David? Share these in the SharePad chat. Login to SharePad – click on the chat icon in the top right – select or search for ‘share chat’.
This article is for educational purposes only. It is not a recommendation to buy or sell shares or other investments. Do your own research before buying or selling any investment or seek professional financial advice.


