In this month’s Funds Focus, David Stevenson looks at a recent report on the consolidation of investment trusts which has some quite revealing headline numbers. Plus he casts his eye over CLO & Charteris Funds and Equal Weight ETFs.
We also ask whether it’s time to switch out of Exchange Traded Funds (ETFs) that track the S&P 500 by market cap, opting instead for an equal-weight version of the index. And last but by no means least some additional ideas for funds tracking the exotic, income-focused Collateralised loan obligations (CLO) space.

Consolidation in the trusts sector
Shonil Chande funds analysts at Panmure Liberum has just released a huge 166-page in-depth report on the incredible shrinking investment trust/companies’ space in the UK. The report isn’t for the fainthearted (it’s incredibly detailed and exhaustive) and its core conclusion is incendiary – the whole listed active funds space is going to end much smaller over the next two years.
At the start of 2023, there were 327 investment companies, excluding VCTs (Venture Capital Trust) and based on the AIC (Association of Investment Companies) sector classifications (including members and non-members of the AIC). This had declined to 299 by 30 September 2024 – a decrease of 28 investment trusts since the end of 2022. Since the end of 2022, 28 funds have departed, including five funds as a result of cash acquisitions and 14 mergers, and two where the continuing vehicle (LondonMetric Property) was not an investment company. Arguably the most dramatic consolidation has occurred in the property space – since the start of 2023, the UK Commercial Property funds sector has nearly halved in size due to five merger & acquisition deals.
This year alone we’ve seen 16 agreed or completed mergers and 9 completed or agreed cash takeouts. There are currently at least 40 funds (13% of the sector) in managed winddown, in strategic review, reviewing the best route to maximising returns to shareholders, or in realisation. 25 were initiated in 2024. Over the next two years, c.70 funds face scheduled continuation votes.
The good news is that this consolidation is also having an impact on cash returned to investors – since the start of 2023, investment companies have returned more than £14bn through buybacks, cash proceeds from completed or agreed take-private deals and other sources. Out of the funds that remain in realisation, c.£1.5bn of capital has been returned cumulatively since 2016.
Chande of Panmure Liberum now believes that the whole investment trust space bottomed out in 2023; the drop-off in liquidity was significant, but conditions have improved incrementally since then. Year-to-date, cumulative traded value across alternative and equity funds is trending more than 30% higher compared to the same point in 2023 on a run-rate basis.
As for winners, one fund stands out – JPMorgan Global Growth & Income (JGGI) has been an active consolidator of other JPMorgan funds, being the continuing vehicle in three deals since 2022 and growing its total assets nearly 7x over the past several years.
CLO funds
Last month I suggested that income-orientated investors take a closer look at the CLO (Collateralised loan obligations) market, dominated by the US and compromising leveraged, structured loans as well as equity. As a segment, it has provided useful income for institutional investors over the last few years, and although declining interest rates can prove something of a headwind for CLO funds, a higher for longer macro-environment might be conducive for CLO funds. I focused most of my attention on the UK-listed fund Fair Oaks, which has an admirable track record. But Fair Oaks isn’t the only fund operating in this broad structured leveraged loan segment. I’d also draw attention to another of my favourite vehicles, TwentyFour Income, which invests in a related segment called asset-backed securities. Looking at the most recent fact sheet for the fund, you’ll see that the fund yields 9.2% on the current share price, while the three-year Net asset value (NAV) volatility is a restrained 7.6%. Its portfolio consists of a close peer to CLOs, residential mortgage-backed securities (RMBS) at around 45% of the portfolio, and CLOs at 38% of the portfolio. In total, these loans yield 12.18% on a mark-to-market basis and 11.5% based on the purchase price. The fund trades at a discount of 5%.
Another one of my favourite vehicles is EJF Investments (EJFI), a small £68m (by market cap ) vehicle that trades at an unwarranted 31% discount to NAV despite offering a very well-backed yield of 9.6% from lending money to smaller regional and local banks in the US through collateralised debt obligations (CDO) structures, which are similar to CLOs but subtly different.
Last but by no means least, if you are feeling much more cautious, I’d also highlight a recently issued active ETF from Fair Oaks, listed in Germany and the UK, called the Fair Oaks AAA CLO ETF. This invests in European floating rate debt with limited interest rate duration risk – the ETF is Euro-denominated. This European segment of the CLO market is much smaller than its American sibling, but it is worth noting that since the first CLO was issued over 25 years ago, no AAA-rated CLO has ever defaulted. The ETF makes quarterly distributions and has 144 million euros in funds under management on a Total Expense Ratio (TER) of 0.35%. The current portfolio yield is 4.8%. This could be worth a closer look if you want some euro income options, though bear in mind that these are floating rate securities, so the yield could decline if the Eurozone slashes interest rates to cope with an impending recession.
Charteris Funds for an informed take on changing macro
I’ve long felt that one of the most difficult challenges facing investors is knitting together three things: asset allocation between high-level asset classes (bonds vs equities vs alternatives), changing macro-economic measures and the possibility that we are entering a whole new macroeconomic regime which makes many traditional strategies are suddenly redundant.
As an example, let’s take the higher for longer new world financial order. This describes a new world where interest rates, though a tad lower than they were, stuck at around 4%. This is a very different financial system than the one we lived in since the Global Financial Crisis and 2008/9 when interest rates were zero bound. Many assets and strategies that did well in the world of quantitative easing might not do well in the new world of quantitative tightening and 4% interest rates. Another way of making the same point is that maybe the exceptional gains made by tech firms over the last 10 to 15 years, which have helped power US equities ever higher, might not be relevant for the next 10 to 15 years.
This is difficult stuff and most fund managers, with specific mandates, to say invest in US equities are hemmed in – they have to do what they say they’ll do. A few managers like those behind Capital Gearing or Personal Assets Trust, or even the Ruffer Investment Company, can range widely between asset classes and take big bets on big ideas but there’s a real shortage of managers with a unique attitude towards both securities selection and macro asset allocation.
There are a few smaller managers worth checking out though, who boast a very distinctive view of economics and investing. I’d highlight the veteran bond market investor Ian Williams of Charteris.
He manages a trio of funds, in bonds, macro investing and precious metals, which all have excellent performance track records, and which all boast strong macro investment calls. Let’s take as an example his high flying – currently – Gold and Precious Metals fund. This is one of the top performers of all unit trusts at the moment, not only because it’s benefitted from the general bullish sentiment towards gold but also because the manager has taken a big bet on silver as a leveraged play on gold i.e. silver tends to outperform gold in bull market cycles. Ian’s core view is that we are entering a new world of big government, ever-bigger fiscal deficits and monetary inflation. That makes him a fan of gold and also some bonds, but not others. The Charteris funds frequently top the performance tables for bonds, multi-asset and precious metals funds but these funds can also have their purple patches, when returns sag behind the benchmark. What you’ll definitely get though is a strong macro call and a clear view of how markets will evolve. I’ve listed the three funds, all of which have small assets under management below, along with some useful headline stats:
- WS Charteris Gold & Precious Metals, £20m, 1 year up 50%
- WS Charteris Strategic Bond, £5m, 1 year up 19.1%
- WS Charteris Global Macro, £5.38m, 1 year, 1 year up 18.5%
Equal Weight ETFs
Sticking with the theme of making sense of macroeconomics and market moves, let’s finish with the US equity market. It’s been a star performer for much of the last decade with the mega large-cap tech leviathans pushing the benchmark S&P 500 index ever higher. The current bull cycle in US equities is heavily concentrated in a handful of (most say seven, a magnificent seven) well-known names, all of which have a strong AI spin to them (with the exception, perhaps, of Apple). This trend could continue for many more months and years if the AI theme plays out as many expect, but it could also broaden out to a much wider set of companies in the S&P 500. There’s also a chance that small and mid-cap US stocks might start to play catch up if, and it’s a big if, Trump wins, and massive tax cuts are lined up.
In essence one key question these forecasts pose is whether investors in the US equities should stay focused on a handful of stocks in the market cap weighted version of the S&P 500 index or look to broaden out their exposure. One way of broadening out your US equities exposure is buying the equal weight version of the S&P 500.
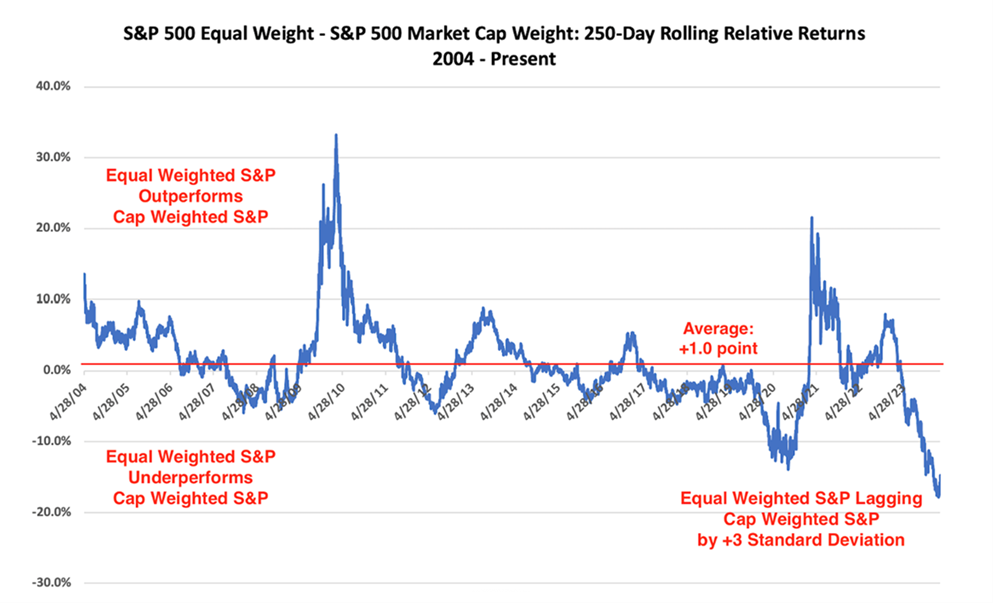
The strategy here is simple. In the most commonly used version of the S&P 500, all stocks are market cap weighted. That means a $100 billion market cap has around 10 times more weight in the index than one that is $10 billion. In an equal weight version, all 500 stocks are rebalanced equally every quarter i.e. each stock is weighted 0.2% in the index (1 / 500). The main impact is that an equal-weight version of an index gives much more weight to mid and smaller-cap stocks in the S&P 500. That can be a good idea in some markets, and a bad idea in other markets – as evidenced by the chart below which shows relative returns for the equal weight version of the index versus the market cap version since 2004.

Source: AAII – March Charts of Interest: The Equal-Weight S&P 500’s Unusual Underperformance
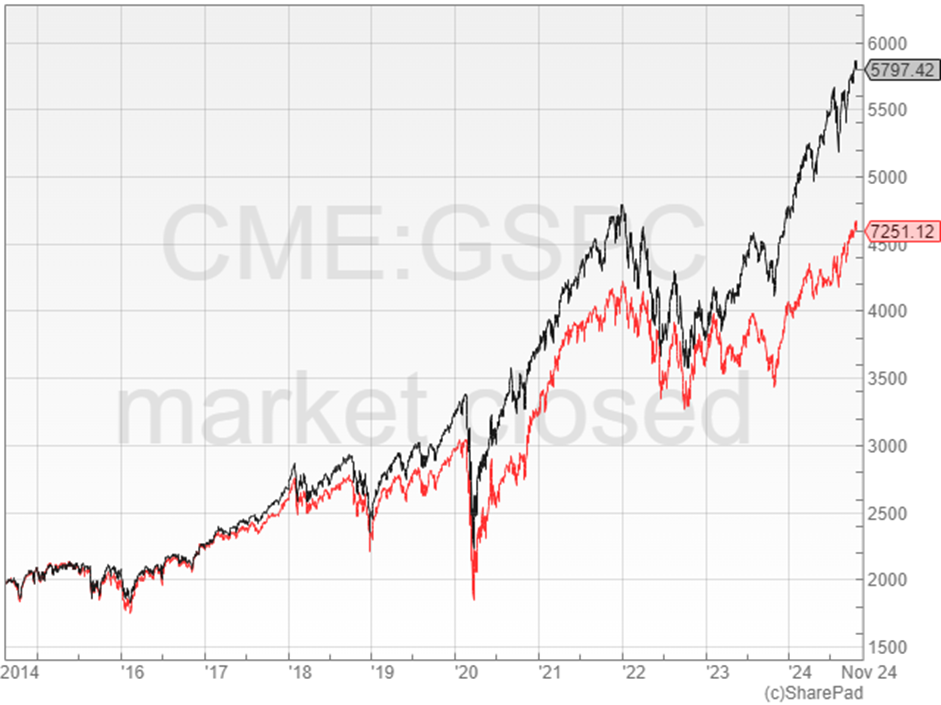
The next table below though shows that for much of the last ten years, the equal weight version has significantly underperformed as the Magnificent Seven tech leviathans have become ever more dominant!
| Name | Price | % change | Volatility (1250) | ||||||||||
| YTD | 1w | 1 mth | 3m | 6m | 1 yr | 2 yr | 3 yr | 5 yr | 10 yr | 20 yr | |||
| S&P 500 | 5797.42 | 22.2 | -0.754 | 1.12 | 6.82 | 14.3 | 36.5 | 52.7 | 27.6 | 92.6 | 195 | 429 | 1.35 |
| S&P 500 Equal Weighted Index | 7251.12 | 13.3 | -1.34 | 0.451 | 7.03 | 9.9 | 30.3 | 32.9 | 12.6 | 64 | 135 | 427 | 1.41 |
| S&P 400 MidCap Index | 3122.46 | 12.6 | -2.36 | 0.113 | 4.13 | 7.64 | 31 | 34.2 | 11.6 | 60.2 | 127 | 432 | 1.59 |
The next chart below maps this out in graphic terms; it shows returns for the market cap version in the back and the equal weight version in red since 2014.

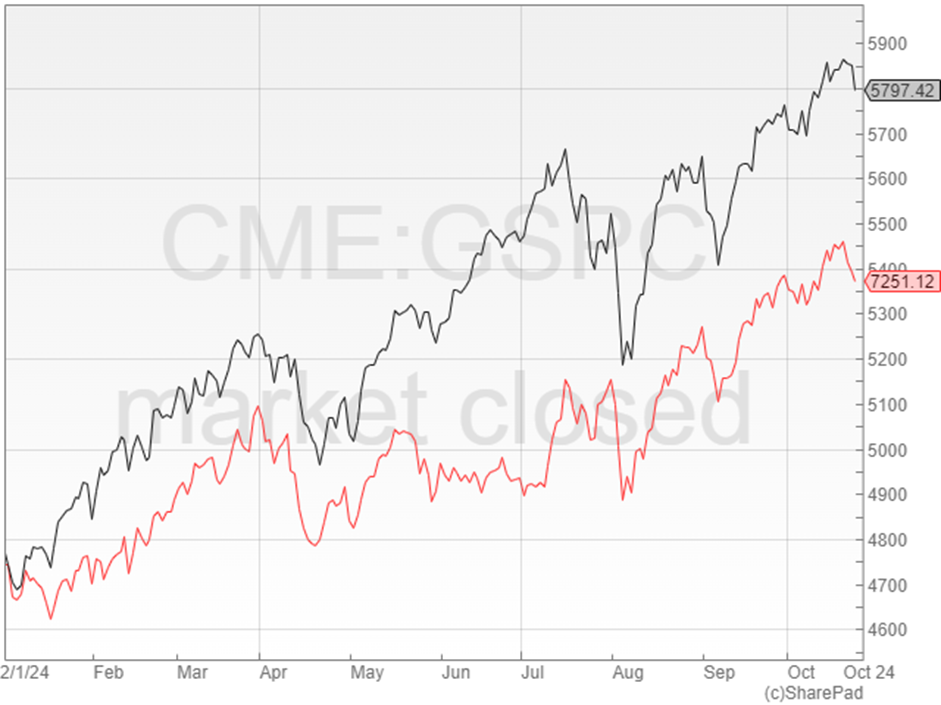
But in recent months the gap between the super successful market cap S&P 500 and the not quite as super successful but still highly rewarding equal weight version narrowed a bit before widening out again in the last few weeks.

Many institutional investors now think the time is right to move back into the equal-weight version of the American benchmark index. Equal-weight ETFs attracted strong interest in the third quarter as investors worried about excessive stock market concentration, according to Morningstar’s European ETF Asset Flows Update. The US research firm reported that although US large-cap equity ETFs remained the market’s favoured exposure, equal-weight alternatives enjoyed strong inflows following the market volatility in July and August. Funds tracking the S&P 500 Equal Weight index pulled in hefty flows, with three appearing in the top 10 of the US Large-Cap Blended Equity category for Q3. The Xtrackers S&P500 Equal Weight ETF (XDEW), the iShares S&P 500 Equal Weight ETF (ESWP) and the XTrackers S&P 500 Equal Weight ESG ETF (XSZP) booked net inflows of €2.1bn, €1.4bn and €1.1bn over the quarter respectively.
ETF news website ETF Stream also reports that the ETFs with the tickers XDEW and ESWP topped the category’s inflow charts for September, indicating renewed demand for the strategy following volatility in the summer. This marks a turnaround for equal-weight ETFs which largely struggled for demand in Q2. XDEW suffered net outflows over the quarter, while ESWP and XSXP both saw subdued inflows. Jose Garcia-Zarate, associate director of passive strategies at Morningstar told ETF Stream that the revived interest in equal-weight strategies: “suggests that some investors are becoming wary of the high concentration in tech stocks found in traditional market-cap-weighted benchmarks.”
My own personal finger-in-the-air guess is that we might see a broadening out of US equity returns and that some of the major tech names might have a rockier Q4, in which case the equal-weight version of the index might be a useful diversifier. There are two main UK-listed S&P 500 equal weight index trackers, both from X Trackers, both exchange-traded funds with one offering a currency hedged return:
- Xtrackers S&P 500 Equal Weight UCITS ETF 1C, ticker XDEW, TER 0.20% p.a., Accumulating, Full replication, £7,239 m, 503 stocks
- Xtrackers S&P 500 Equal Weight UCITS ETF 1D GBP Hedged, Ticker XEWG, TER 0.30% p.a., Distributing, Full replication, £82m, 5-3 holdings
~
David Stevenson
Got some thoughts on this week’s article from David? Share these in the SharePad chat. Login to SharePad – click on the chat icon in the top right – select or search for ‘share chat’.
This article is for educational purposes only. It is not a recommendation to buy or sell shares or other investments. Do your own research before buying or selling any investment or seek professional financial advice.


