
In the latest in the series, we have an investor with over 10 years of experience who is relatively new to ShareScope – Andrew. He is sharing a bit about his investing history and how he uses ShareScope.
If you have your own routine you would like to share, or some interesting custom settings, layouts or screening filters – we would love to hear about you and them! Just send them in to marketing@sharescope.co.uk. When we publish them, we’ll even add a free month to your account!
Andrew @andrewinvestor7
Investor Experience
I started investing in 2010 but, lacking experience, I decided to stop buying individual stocks, which included selling Experian in 2012! I returned to investing in 2019 with a more informed and serious approach.
ShareScope Experience
Since 2021, the things I like most about the tool are:
- The level to which I can customise it to my needs.
- The fact that there is no lag when navigating from one view to another.
How often do you use ShareScope?
I log in each morning to read announcements and check initial movements post-market opening. Then I review my portfolio in the evenings after the market has closed. If I use it at the weekend it will be to research new ideas.
How I use ShareScope
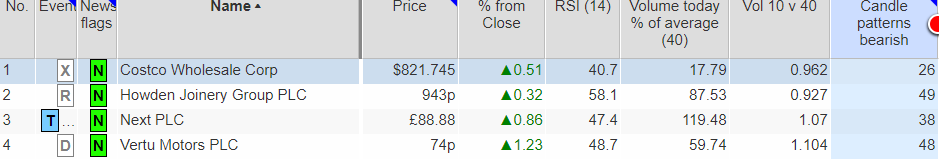
For portfolio monitoring on weekdays, my go-to is a list setting, which I have configured to look at:
- The current day’s price movement and volume versus the 40-day average. Any spikes act as a trigger for me to check the company further.
- Upcoming dividends. This is so I don’t misinterpret a price movement when the company goes ex-dividend!
- A couple of key technical indicators. I try to avoid buying or adding to positions when the 14 RSI indicates the company is overbought.
I have also curated a key metrics list, covering quality and safety aspects. This was inspired initially by Phil Oakley’s step-by-step guide to investing, published on the ShareScope site. I use this to see if any fundamentals have changed amongst my holdings.
Recently, I created a momentum list that I use to accompany chart analysis. I’ve changed my perspective and think it is a lot easier to enter (or add to) positions when the trend is with you, post a positive catalyst.
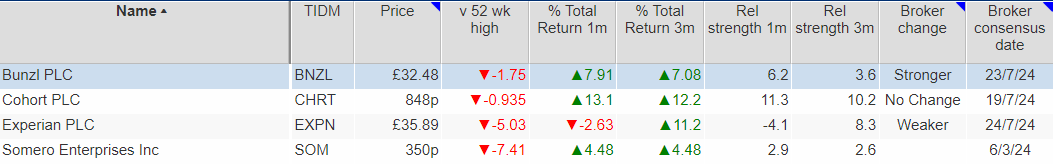
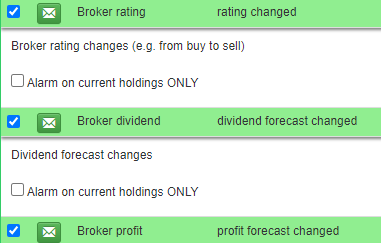
I use the alerts and have almost maxed mine out. The latest ones I have found useful are changes in analyst forecasts. These changes were something I was historically missing post-RNS performance update announcements.
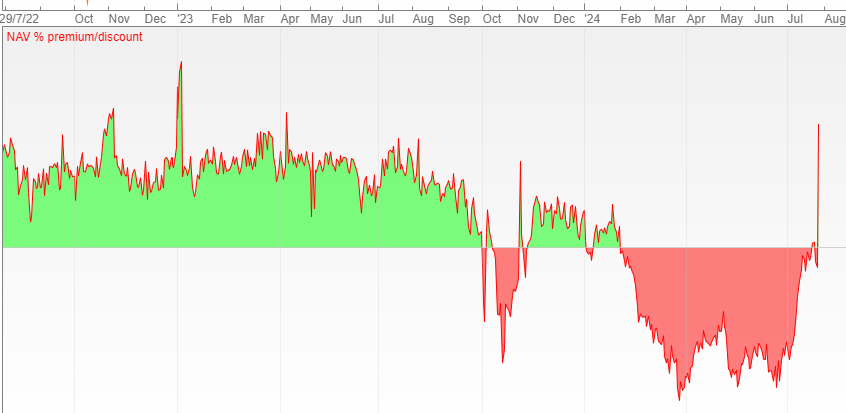
Finally, I hold a few investment trusts. I will create portfolios that mimic the top 10 holdings. This makes it easier to run the rule over things, such as forward valuations, broker sentiment etc. For the trust itself, I regularly use the indicator that enables me to track the discount to NAV. Hopefully some of them narrow in the rest of 2024!
Got some thoughts or questions on the ‘How do YOU’ above? Leave them in the comments below.
And remember, if you have your own routine you would like to share, or some interesting custom settings, layouts or screening filters – we would love to hear about them! Just send them in to marketing@sharescope.co.uk. When we publish them, we’ll even add a free month to your account!

This article is for educational purposes only. It is not a recommendation to buy or sell shares or other investments. Do your own research before buying or selling any investment or seek professional financial advice.


Hi Andrew
Please forgive me for writing but i have been reading your article and trying to get to grips with the lists you use.
Having used Sharescope for some 15 years in the last two months I have changed to SharePad, almost everyday finding new ways of obtaining data from it.
I have managed to reproduce most of the lists in your article but have the following queries if you could be kind enough to reply:
” v 52 wk high ” I can’t reproduce this are exactly or what it is showing, perhaps you have changed the heading ?
I have not used Candlestick patterns before, could you say what patterns you set to look for from the Sharepad list both bearish and bullish ?
Also, Relaxed or Standard setting , I assume Daily ?
Thanks again for taking the time to read, regards and thanks
Derrick
Hi Derrick,
Hope you’re well and sorry for the late reply.
1. For “v 52 wk high” yes I have changed the setting. It is under: Price > High/Low since and then the Date is set to 52 weeks ago and to display the % change
2. I set this column more as a trigger to ensure I review the chart pre entering or adding to a position. Yes I set it to daily and relaxed.
I set it to look for the more common patterns (so for bearish Hanging man, Bearish engulfing, Evening Star, Evening Doji Star, Shooting Star, Bearish Doji and Three Black crows). And then the equivalent letters on the bullish side.
Hope this answers all of the points above.
Thanks
Andrew
Many thanks Andrew, I have now replicated your lists.
Thanks again
Derrick