Many private investors like to build a portfolio of individual shares in order to grow the value of their savings as well as trying to beat the market as a whole. But some also like to complement their portfolios by owning investment funds.
One of the best and easiest ways to do this is to buy the shares of investment trusts. I am generally a fan of investment trusts – providing the costs of running them are not too excessive. The main reason why I like them is because they are closed end funds.
The problem with open ended funds (which used to be more commonly known as unit trusts) is that they can always take in money from new or existing investors. This also means that investors can also cash in their investments when they like.
This creates problems for the managers of an open ended fund. A big inflow of money can make the fund more difficult to manage. For example, the manager might not be able to take a big position in a small company without pushing the share price up too much.
During times of falling stock markets there is a tendency for investors to panic and cash in their investments. The manager then has to sell the shares in his portfolio in order to find the cash to pay investors. This can mean selling holdings of their best investment ideas.
The investment trust manager has no such problems. Investment funds are raised by selling shares in the trust. Once the manager has that money, it cannot be taken away from them. It is a source of permanent capital to invest. This means that the manager is free to get on with managing the fund. If investors want their money back, they have to sell their shares through a stockbroker.
Analysing investment trusts in SharePad
In this article, I am going to show you how you can go about weighing up an investment trust in SharePad. This is very straightforward as it has a dedicated investment trust list. You can do some but not all of this analysis in ShareScope; I’ll indicate what you can and can’t do as I go through.
SharePad allows you to filter investment trusts according to their specialist sector. You can then add specific investment trust columns to help you to analyse them better. Below is the top 10 performing investment trusts over the last year in the Global equity sector.
Top 10 Global Equity Investment Trusts over one year

Note: ShareScope users have all these data items apart from Z-score.
Now let’s go about looking at an investment trust in more detail. I am going to concentrate on Scottish Mortgage Trust (SMT), one of the most popular investment trusts at the moment.
Long-term performance
Past performance is no guarantee of future performance but a good long-term track record is rarely a bad thing.
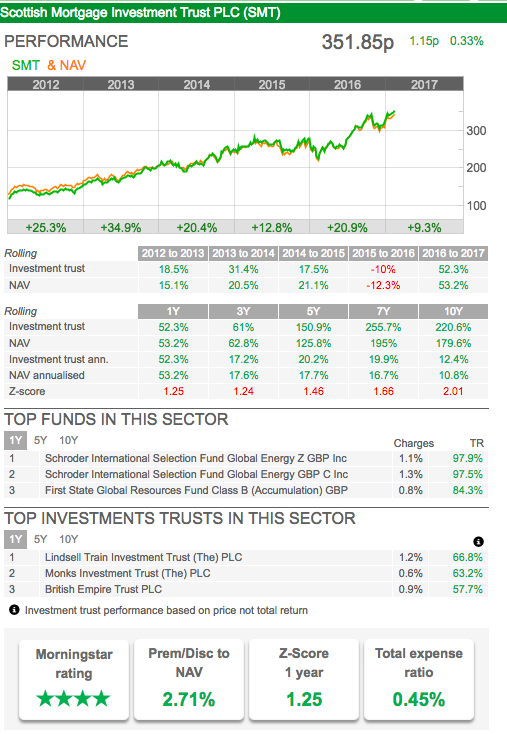
Scottish Mortgage Trust has produced total returns of 57.2% over the last year, 165% over five years and 246% over ten years. This has been a consistently good investment trust to own.
Contrast this with British Empire Trust (BTEM) which has returned 62.6% over one year but only 71.4% over ten years. Most of its ten year gains were made in the last year.
Premium or discount to net asset value (NAV)
Open ended funds always trade at the net asset value of the investments in them. This is not true for investment trusts where the share price can be different from the NAV.
Unsurprisingly, some top performing investment trusts attract new buyers. This can push up the share price to a level above the NAV per share. If this happens the shares are said to be trading at a premium to NAV. Conversely, poor performing trusts or trusts in unpopular investment classes can see their shares trade below their NAV per share – known as a discount.
The very successful Lindsell Train investment trust trades at a whopping 44.7% premium to its NAV, whereas British Empire Trust trades close to a 10% discount. Scottish Mortgage Trust trades at a small premium to NAV.
Personally, I would never buy an investment trust trading at a big premium to NAV. It just feels too risky, a bit like buying an individual share with a very high PE ratio. If the fund’s performance stumbles then that premium could fall significantly which could see an investor lose a lot of money.
Looking at trusts trading at discounts to NAV is more akin to value investing – looking for bargains. Here you are buying a basket of shares for less than they are worth. Sometimes these trusts can be taken over or get a new fund manager which can improve performance and narrow the discount.
Investors and trust companies can find big premiums and discounts unsettling. This has led to some trusts to operate a discount and premium control mechanism so that the shares trade as closely to NAV as possible. These mechanisms operate as follows:
- Premium to NAV – issue new shares. This increases the supply of shares in issue but the shares will be issued above NAV so as not to disadvantage existing investors.
- Discount to NAV – buy back shares and cancel them. This has the effect of increasing NAV per share. This is easier said than done, especially for smaller trusts or trusts investing in illiquid assets as it can be hard to raise the cash to buy back shares.
Z-score
Not to be confused with Altman’s Z-score which looks at the bankruptcy risk of companies, an investment trust Z-score helps the investor tell if the trust is cheap or expensive relative to its average premium or discount to NAV over a specified period.
The Z-score is calculated as follows for a trust trading at a discount/premium to NAV:
Z-score = (Current discount/premium – average discount/premium)/standard deviation
The standard deviation tells you how volatile the premium or discount has been – how much it has moved around its average (mean) value.
The Z-score is telling you whether the current discount or premium is above or below the average value and by how many standard deviations. SharePad calculates Z-scores for periods of 1, 3, 5, 7 and 10 years.
The simple rules of interpreting a Z-score are:
| Price vs NAV | Z-score | What it means |
|---|---|---|
| Premium | Positive | Premium is larger than average (more expensive) |
| Premium | Negative | Premium is smaller than average (less expensive) |
| Discount | Positive | Discount is smaller than average (not as cheap) |
| Discount | Negative | Discount is larger than average (even cheaper) |
A short-term Z-score is useful for weighing up the current sentiment towards the trust whereas a longer term Z-score can give you a better picture of how the trust is perceived.
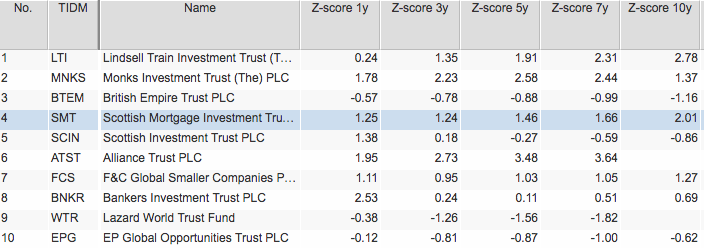
Scottish Mortgage Trust has a one year Z-score of 1.25. This is telling us that the current premium of 2.71 (see earlier table) is bigger than its average one year premium by 1.25 standard deviations. The 10 year Z-score is telling us that the current premium is higher than the 10 year average by just over 2 standard deviations.
These Z scores are telling us that Scottish Mortgage Trust might be slightly expensive based on its current Z-score but that it has become less expensive in the last year as the one year Z-score is lower than the 5 and 10 year scores.
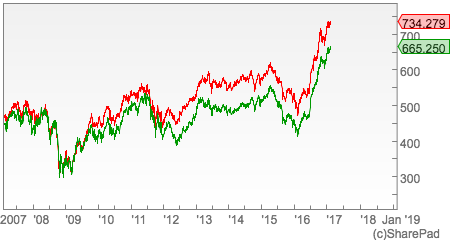
British Empire Trust has a negative one year Z-score of -0.57 which is telling us that its current discount to NAV is slightly larger than its one year average discount. A look at BTEM’s chart will tell you that its discount to NAV has remained fairly constant for the last 5 years but it has widened recently during the last year.
Filtering for cheap and expensive investment trusts using Z-scores
Professional investment trust analysts might use Z-scores to identify trusts which might be cheap or expensive relative to their average premiums or discounts.
As a rough rule of thumb a Z score of +2 might be seen as relatively expensive – the current premium is too high, discount too small. Whereas a score of -2 might be seen as cheap i.e. the premium is lower than usual or the discount larger than usual.
This rule is based on a theory known as reversion to the mean. In other words, the trust will eventually return to its average premium or discount and divergences from it show the trust to be cheap or expensive.
This might help people to trade investment trusts but long-term investors need to take some time to understand why a trust is trading at a premium or a discount (e.g. fund performance, popularity of investments in the fund) and what has caused it to change.
You can easily set up a filter in SharePad to identify investment trusts meeting these criteria (you can filter for trusts trading at a discount or premium to NAV in ShareScope but you can’t filter for Z-scores).
Possibly expensive investment trusts
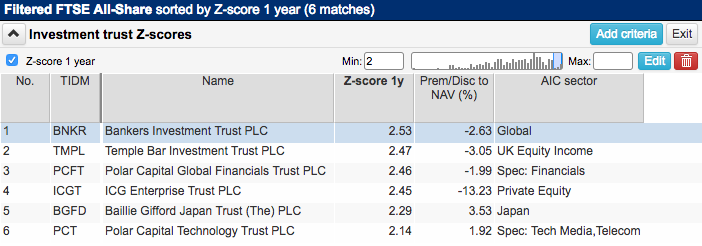
Possibly cheap investment trust

I’ll explain how to create these filters at the end of the article.
Total expense ratio
You should pay attention to how much an investment trust costs to run. One of the biggest costs is the manager’s fee. These fees have been coming down in recent years. The total expense ratio (TER) gives you an indication of how cheap a fund is to own but it is not a perfect measure as it excludes the costs of buying and selling shares (spreads, commissions and stamp duty).
Most fund managers – Fundsmith being a notable exception here – won’t tell you what the total cost of investing is for their fund. You can have a go at working this out if you are prepared to spend some time scrutinising the fund’s accounts and the accounts give you enough information. Failing that investors have to look at the TER or ongoing charges figure.
Scottish Mortgage has a very competitive TER of 0.45% and has provided its investors with good value for money. Generally speaking anything over 1% is beginning to look quite expensive.
You should also check to see if the manager charges a performance fee on top of the normal annual fee.
Gearing
Investment trusts can juice up the returns to their shareholders by borrowing money. This increases returns when the fund’s assets are increasing in value but magnifies losses when they are falling in value.
If you want to sleep easily with your investment trust shares then owning trusts with no borrowings is probably the way to go.
Gearing ratios for investment trusts are calculated differently than for companies in general. They measure the ratio of the trust’s gross assets to its net assets. So a fund with gross assets of 100 with borrowings of 20 would have net assets of 80.
Its gearing ratio would be (100/80) x 100 = 125. It is 25% geared.
An investment trust with no borrowings would have a gearing ratio of 100.
Scottish Mortgage Trust is using a modest amount of gearing and has a gearing ratio of 108.
Investment Trust information in SharePad
SharePad allows you to quickly view the key information for an investment trust such as performance data, expenses, premiums and discounts and Z-scores. This is on the Summary tab of the Financialsview. It also tells you the top performing funds and investment trusts in the same sector as the trust you are looking at for comparison.
NOTE: You can add this display in ShareScope as well. To find out how, watch the short video on the ShareScope Training Zone – scroll down the list of tutorials to the Financial data and Details screensection and click on Fund & Bond Summary. Alternatively, call Support on 020 7749 8504.
You can drill down further still.
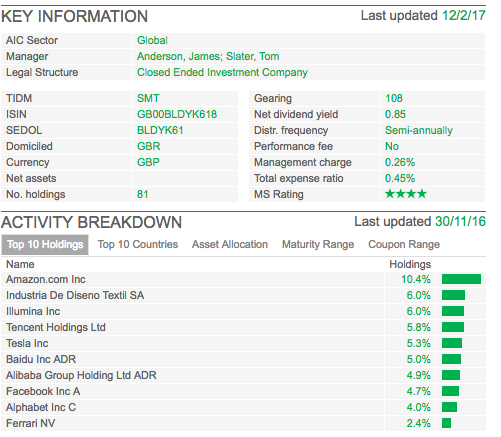
Here we can see information on gearing, charges and how often a dividend is paid. We can also see that this investment trust holds 81 different shares and the top 10 holdings of the trust.
Scottish Mortgage’s biggest holding is Amazon.com which makes up over 10% of the fund. The managers seem to like technology and innovative companies such as Tesla and Facebook. The top 10 holdings make up 54.5% of the fund’s assets.
If we look at the top 10 countries, we can also see that the fund is taking big bets on American and Chinese shares.
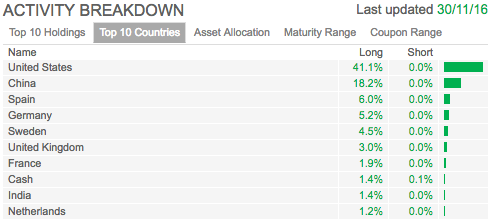
The fund is not taking any short positions (i.e. betting on share prices falling).
Creating a Z-score filter in SharePad
To set up the filters shown earlier in the article, follow these steps:
- Click on the Other lists button and select Investment trusts.
- Click on the Filter button and select Quick filter.
- Click on the Add criteria button.
- Click on the Funds & Bonds tab in the Add criteria dialog.
- Scroll down to the Investment trusts section and select Z-score.
- Choose the time frame and then click on OK.
- Select the minimum and or maximum values. For example, select a maximum of -2.0 to find trusts with a Z-score greater than this (cheaper than average).
- Remember you can add further criteria for aspects such as premium/discount to NAV, gearing and TER. You’ll find all of these in the same section as the Z-score criterion.
- To add a criterion which filters for one or more sectors, click on the Company tab in the Add criteria dialog and then click on Sector.
- Click on OK and a further dialog will be displayed. Use the two drop-down menus at the top to select AIC sectors and whether you are choosing the sectors to include or exclude from the filter.
- Beneath these drop-down menus you’ll find a list of investment trust sectors. Click on the ones you want to include/exclude. Click on OK when complete.
- If you want to save the filter, click on the Keep button.
This article is for educational purposes only. It is not a recommendation to buy or sell shares or other investments. Do your own research before buying or selling any investment or seek professional financial advice.


