
Looking to capture rising trends with ShareScope? We’ve created this Momentum Stock Screening Guide to go with our off-the-shelf Momentum Screen to help you learn how to spot them. It’s designed to highlight the key signals we believe matter when searching for stocks showing real strength.
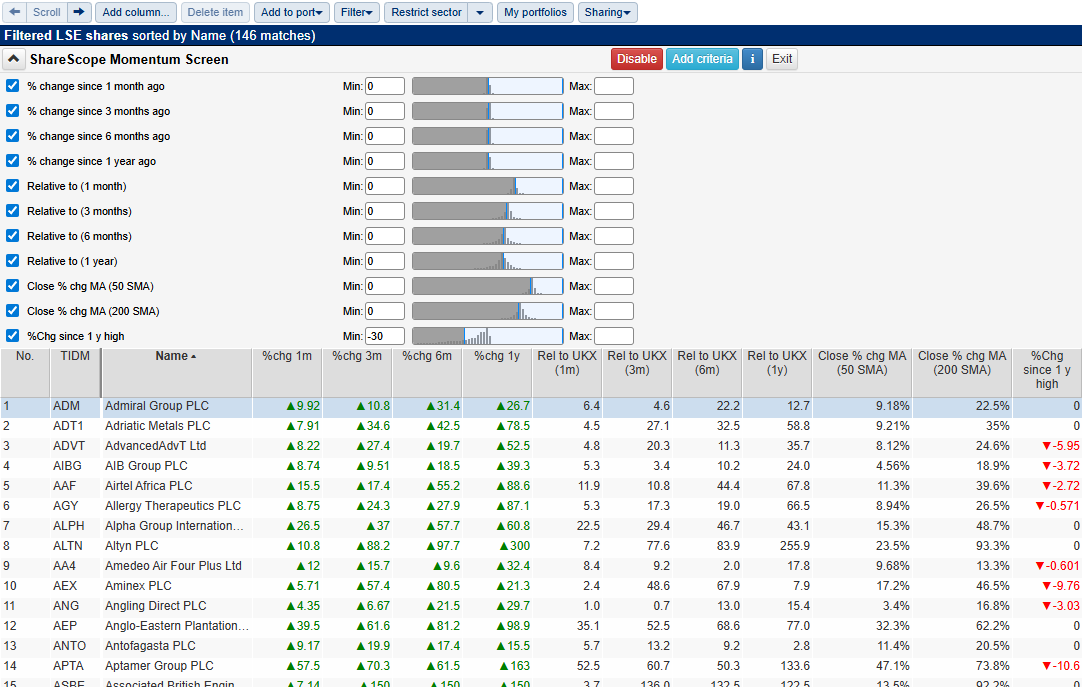
ShareScope subscribers can apply this screen at the click of a button on the home page in ShareScope – click on the “house” icon near top left of the program and then scroll down the home page to the Popular Stock Screen section.
Use it as a starting point: explore the logic, dig into the data, and then make the screen your own.
What Is a Momentum Stock?
A momentum stock is a company whose share price is consistently rising and outperforming the broader market. Momentum investors look for sustained upward trends, betting that “what’s going up will keep going up”—at least for a while. The key is to catch the wave and ride it.
Why we choose these criteria
1. Positive Price Movement Across Timeframes
- % Change Since 1, 3, 6 Months and 1 Year Ago ≥ 0%
Stocks must show positive returns over each of these four periods. This ensures the momentum isn’t just a short-term spike—it’s persistent across timeframes, signalling strength and staying power.
Jargon Lite Version: The stock’s price is up over every recent period, not just spiking—a healthy trend.
2. Outperformance vs Market
- Relative to FTSE 100 (1, 3, 6 Months and 1 Year) ≥ 0%
Each period compares the stock’s performance to the FTSE 100 index. A score above 0% means the stock is beating the market—not just going up, but leading the pack.
Jargon Lite Version: You’re holding a leader, not just a follower—returns are outpacing a major benchmark.
3. Technical Strength
- Close % Change from 50-Day SMA ≥ 0%
This shows the stock is trading above its short-term average, confirming near-term strength and confirming the trend hasn’t faded.
Jargon Lite Version: Momentum is intact, the price hasn’t dipped below a key short-term level. A 50-day moving average (MA) is a way to smooth out the fluctuations in a stock’s price over time, providing a clearer picture of its general trend. It’s calculated by averaging the closing price of a stock for the past 50 trading days. Each day, the oldest price is dropped, and the newest price is added, creating a constantly updated average.
- Close % Change from 200-Day SMA ≥ 0%
The longer-term moving average gives us a wider view. A stock above its 200-day average shows strong long-term trend adherence, reducing risk of sudden reversals.
Jargon Lite Version: Price is trending upward in the long term too – reducing risk of trend reversal. As with above, a 200-day moving average smooths out the fluctuations in a stock’s price over 200 days.
4. Price Proximity to Highs
- % Change Since 1-Year High ≥ -30%
We’re not looking for all-time highs, but we also don’t want deep pullbacks. Stocks that are within 30% of their 1-year highs are more likely to resume upward movement than those in a heavy slump.
Jargon Lite Version: A pullback refers to a temporary price change against the prevailing trend in financial markets. It occurs when the price retraces or “pulls back” from its recent high before potentially resuming its original direction. By filtering out stocks that have dropped further than 30% we’re attempting to protect ourselves from stocks that may have dropped too far and hence may not revisit highs.
Who Is This For?
This screen is ideal for:
- Active traders seeking momentum plays
- Trend-following investors
- Anyone looking to capitalise on recent market strength
Make It Your Own
Momentum strategies can move fast—so tweak this screen to reflect your goals:
- Focus on shorter timeframes to catch quicker swings
- Add volume or volatility filters for additional confirmation
- Use price breakout criteria to time entries
We’d love to hear your thoughts. Do these criteria match how you look for momentum? Would you tweak or add anything? Maybe you’ve built your own momentum screen that works well. Share your ideas in the comments—whether it’s feedback, suggestions, or your own strategies.
This article is for educational purposes only. It is not a recommendation to buy or sell shares or other investments. Do your own research before buying or selling any investment or seek professional financial advice.


Thanks for this Price momentum screen etc. Personally I also look at estimate revisions as part of the momentum picture in a stock. With things like 1 and 3 month change in estimates and the number of analysts upgrading or downgrading etc. versus total number of analysts.
It seems you might have this kind of data as in the forecasts page you can display a graph of the current year estimate and how it is changed.
I have asked previously if it would be possible to include the % changes in estimates over 1 month and 3 months as screenable items, but as far as I’m aware this is still not available on here, unless I’m mistaken? So I’d suggest / ask again would it be possible to add estimate revision data as a screenable item please?
Hi Jamie, thanks for the feedback and apologies for the delay in getting back to you.
Good news – as of May 2025, it is now possible to add the broker upgrade column for a range of metrics (Turnover, EPS etc) and over 4 intervals (including both 3 months and 1 month).
You can also incorporate this functionality within your stock screens.
As we receive consensus mean values from our supplier, it is unfortunately not possible however for ShareScope to identify how many analysts are upgrading or downgrading.
I hope that helps.
I have a Geopolitical screen, Defence screen and a”Nuclear screen” and watch for the overlap, eg Rheinmetall, Cameco, and Leonardo
Thanks for sharing this – that’s a really interesting way of approaching it. Building thematic screens like your Geopolitical, Defence, and Nuclear lists, and then looking for the overlap, is a smart way of narrowing down to the strongest candidates. Other readers of this guide will no doubt find your screening method useful to think about too.
Thanks – this is a great screen. Can you please clarify why the stocks are sorted by Price % from close?