Castings plc is a foundry business. Foundries are factories which produce metal castings. Castings has two in the UK – in the West Midlands and South Yorkshire – which take scrap steel and alloys and turn them into castings up to 40kg in weight. It also has a machining business which allows it to turn its castings into more specialised products.
Most of the castings produced end up in heavy trucks and commercial vehicles but are also found on railway lines and in general industrial applications. During the year to March 2017, 72% of Castings’ sales were exported.
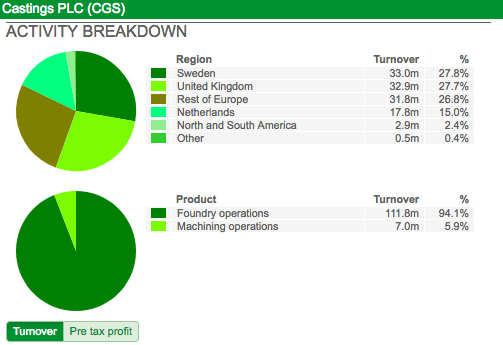
Note: Turnover relates to external sales only
The fact that Castings is still in business is testament to the strategy pursued by its management. Not so long ago there were people who questioned whether foundries could exist in the UK. It was thought by some that it was the type of business that would gravitate to the Far East and low cost operators.
This doomsday scenario has not come to pass. The big truck and automotive customers have put quality and local supply chains ahead of costs. Companies such as Castings have also played a part in staying relevant to its customer base.
It has invested heavily in new, better technologies – such as 3D printing and scanners – to give it the capability to make better and more cost-effective products for its customers. Well-invested plant and machinery has also made the production process more efficient and potentially more profitable when demand levels are good.
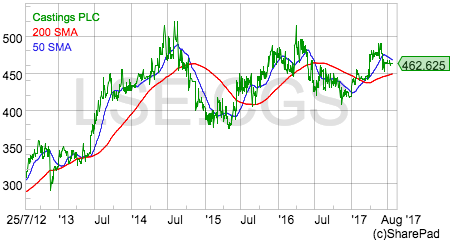
Castings has developed a loyal fan base amongst investors and has been lauded for its simple, straight-talking approach, well-invested asset base and sound financial position. Yet as the chart above shows, its share price has been very volatile. This is largely due to the fact that its fortunes are largely out of its control as customer demand for its products has a tendency to be patchy.
The company does not tend to say too much about what is going on with its business. Its annual and interim reports tend to be quite short and to the point on detail. However, with a bit of digging it is possible to understand this business a little better.
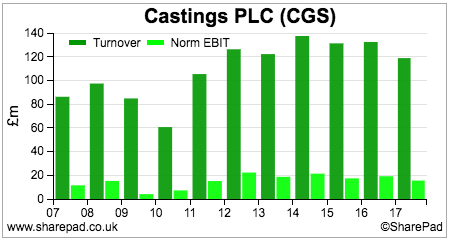
One of the first things I do when I first start looking at a company is to try and find out what happens to its sales and profits in a recession. I like to own shares in resilient businesses and try to minimise my risks of owning a share at the wrong time in the economic cycle.
As you can see from the chart above, Castings is a cyclical business as shown by the fact that its sales and profits fell quite heavily during the last recession. This is confirmed by a study of its long-term operating (EBIT) margins.
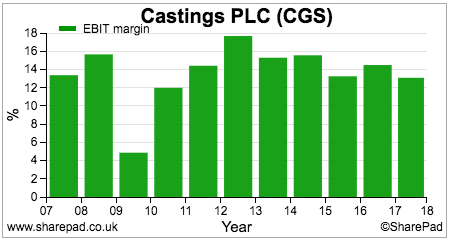
The current EBIT margin is just over 13% which is broadly in line with its ten year average. This is a decent level of profit margin which gives the company a reasonable degree of protection from a downturn in demand. As you can see, this is needed as margins plummeted in 2009. Note that margins have been on a downwards trend since peaking in 2012 and this is something that needs to be watched.

A similar trend has been playing out with Castings’ return on capital employed (ROCE). It has been falling for the last five years and now stands at 11.6% compared with a ten year average of 15.6%. This suggests to me that Castings is a very reasonable business but not a great one.
Its business has also been very capital intensive over the economic cycle as evidenced by capex as a percentage of operating cash flow – its capex ratio – averaging 66% over the last decade.
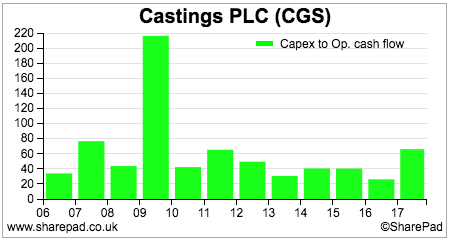
This has resulted in a not particularly good performance of turning its profits into free cash flow.
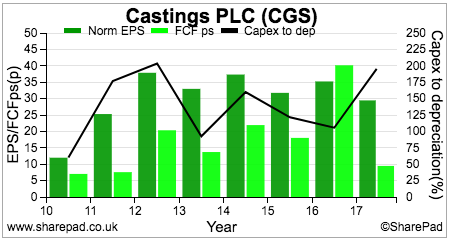
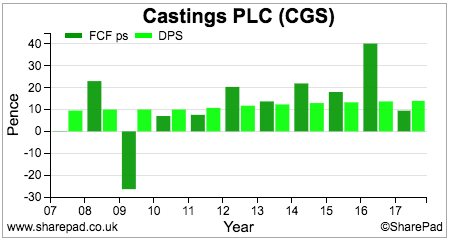
Yet over the last decade, the company has produced sufficient cumulative free cash flow to pay its annual dividend to shareholders. Castings also paid a one-off special dividend last year.
All the investment and dividends paid out has been done with a debt-free balance sheet and without asking shareholders for new money. The company does have a final salary pension scheme which is currently in surplus to the tune of £16.8m. This is not shown as an asset on the balance sheet as the company has no right to receive any refunds from this surplus.
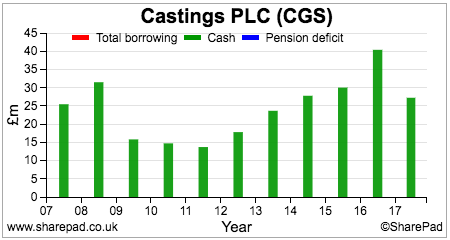
The fact that Castings has cash balances reduces its risk to shareholders. Its business has quite high fixed costs and therefore high levels of operational gearing – meaning its profits are very sensitive to changes in sales – and so there is a significant risk already without adding debt to its balance sheet.
Trying to understand Castings a little bit better
As I mentioned earlier, Castings does not say too much about its business and does not give investor presentations to analysts. However, it does give enough information to allow a bit of number crunching to shed a bit more light on its operating performance.
Foundry operating performance
| Year | Tonnes sold | External sales (£m) | Revenue per tonne | Profit (£m) | Profit margin | Op Costs (£m) | Cost per tonne |
|---|---|---|---|---|---|---|---|
| 2017 | 47200 | 111.8 | £2,369 | 14.5 | 12.97% | 97.3 | £2,061 |
| 2016 | 52000 | 114.7 | £2,206 | 14.7 | 12.82% | 100 | £1,923 |
| 2015 | 52700 | 113.3 | £2,150 | 13.1 | 11.56% | 100.2 | £1,901 |
| 2014 | 57600 | 119.9 | £2,082 | 16.2 | 13.51% | 103.7 | £1,800 |
| 2013 | 52700 | 106.7 | £2,025 | 14.7 | 13.78% | 92 | £1,746 |
| 2012 | 57200 | 117 | £2,045 | 17.8 | 15.21% | 99.2 | £1,734 |
| 2011 | 50600 | 97.2 | £1,921 | 11.6 | 11.93% | 85.6 | £1,692 |
| 2010 | 31800 | 58.1 | £1,827 | 5.4 | 9.29% | 52.7 | £1,657 |
| 2009 | 43900 | 83.1 | £1,893 | 6.7 | 8.06% | 76.4 | £1,740 |
| 2008 | 56400 | ||||||
| 2007 | 53500 | ||||||
| 2006 | 50800 |
The company tells you how many tonnes of castings were sold and the external revenue achieved from them. It also gives you the operating profits made by the foundries. From this information it is possible to work out the following:
- Revenue per tonne of castings sold
- Cost per tonne sold
- Operating margin
The revenue per tonne achieved will be determined by the selling price – which in turn is a function of costs and built in margin – and the sales mix (the types of casting being sold).
Foundries are very energy intensive businesses with the furnaces consuming significant amounts of electricity. Changes in electricity prices can usually be recovered in selling prices but with a short time lag.
A rising revenue per tonne can be a good sign and show that the company is selling more profitable products. Or it can just be a sign that the company is passing on its higher costs in selling prices.
| Changes | Revenue per tonne | Cost per tonne | Incremental profit |
|---|---|---|---|
| 2017 | £163 | £138 | £25 |
| 2016 | £56 | £22 | £34 |
| 2015 | £68 | £101 | -£33 |
| 2014 | £57 | £55 | £2 |
| 2013 | -£21 | £11 | -£32 |
| 2012 | £125 | £43 | £82 |
| 2011 | £94 | £34 | £59 |
| 2010 | -£66 | -£83 | £17 |
To try and get a feel for what is going on you can calculate the incremental revenue, cost and profit per tonne sold. What we can see here is that incremental revenues have been increasing faster than costs for the last couple of years. This seems to be supportive of the company’s claim that it is selling more profitable castings and improving its sales mix.
This has seen a decent improvement in foundry operating margins since 2015. As well as sales mix, margins are a function of capacity utilisation and how well loaded the foundries are.
High utilisation – output as a percentage of total capacity – allows the company to cover its fixed overhead costs more easily and make more profit from incremental sales once this has been achieved. You can see how fast demand fell during the last recession and the low levels of profit achieved.
This shows the key risk that investors in this company face if demand turns down. Profits can be very sensitive to changes in demand.
You can also see how lumpy demand and sales can be from year to year. 2012 and 2014 were years of high demand and profitability due to changes in demand from truck companies caused by model changes and new emissions standards.
Overall we can see that Castings tends to manage this business reasonably well in terms of demand changes. But we can also see that profit growth has been hard to come by. This is unlikely to change in 2018 as demand from customers is expected to be stable rather than growing.
CNC Speedwell, Castings’ machining business has been going through a tough time following a loss of a major contract recently.
CNC Speedwell (£m)
| Year | Sales | Profit | Margin |
|---|---|---|---|
| 2017 | 23.3 | 1.5 | 6.44% |
| 2016 | 33.2 | 4.7 | 14.16% |
| 2015 | 31.4 | 4.5 | 14.33% |
| 2014 | 31.5 | 5.2 | 16.51% |
| 2013 | 27.2 | 3.8 | 13.97% |
| 2012 | 20.5 | 4 | 19.51% |
| 2011 | 19.9 | 3.4 | 17.09% |
| 2010 | 7.9 | -0.4 | -5.06% |
| 2009 | 10.7 | 0.9 | 8.41% |
This business is capable of making very good profit margins but has been hammered by the loss of a major contract. This lost business has been replaced but will take a couple of years to recover all the lost sales. In the meantime, extra costs have been incurred for the new business which is acting as a drag on profits.
However, as the new business builds up the machining division could be a source of profits growth for Castings as a whole. But not until 2019 according to analysts’ forecasts.

This seems to marry up nicely with what the share price is implying about future profits in that not much sustainable growth is expected. The earnings power value (EPV) based on its last annual trading profits give a value of 426p per share. At the moment this feels about right to me. The dividend yield is reasonable and there should be some modest dividend growth to keep investors reasonably happy.

This article is for educational purposes only. It is not a recommendation to buy or sell shares or other investments. Do your own research before buying or selling any investment or seek professional financial advice.


