RPC (rigid plastic containers) designs and manufacturers plastic products for packaging markets. The company makes thousands of different products such as plastic bottles, food containers, plastic tubes, paint containers, wheelie bins and bin liners. Plastic is everywhere in our lives and there is a good chance that most of us use or come across an RPC-made plastic product every day of the week.
The company also uses its plastic technologies – such as highly specialised plastic moulds – to make products for other markets such as automotive and the medical industry. A breakdown of its turnover is shown below:
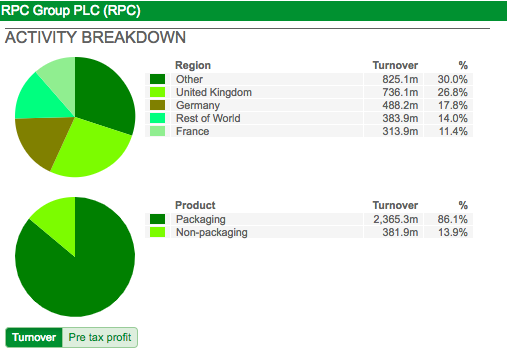
86% of group turnover and 80% of trading profit come from the Packaging division. 73% of turnover is denominated in foreign currencies.
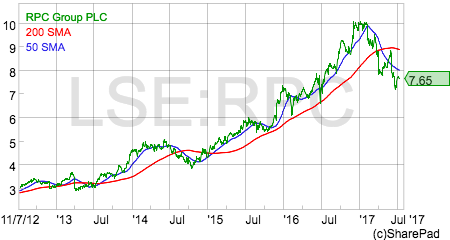
The company’s share price had performed well until the start of 2017 but has since fallen by almost a quarter. The only reason I can see for this is that perhaps there is a growing concern amongst investors that the company is becoming too reliant on acquisitions in order to grow its sales and profits.
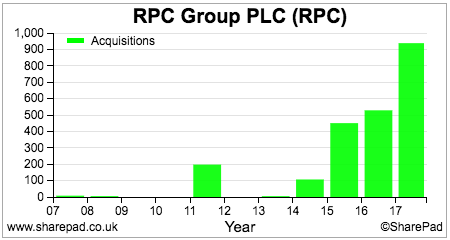
RPC has spent over £2bn buying companies since 2014 with 2016/17 seeing over £1bn shelled out (including deferred consideration).
The company has also issued a significant number of new shares to fund its spending spree.
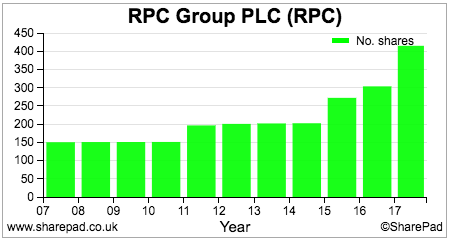
Large chunks of money spent on acquisitions combined with significant amounts of new equity issuance have a tendency to upset shareholders. Investors have learned to be suspicious of acquisitive companies as the strategy is often used to mask a weak or declining underlying business.
Using shares as part payment or using share placings to raise money also dilutes existing shareholders (Note: rights issues are not dilutive to existing shareholders as they can maintain their ownership stake in the business).
Acquisitions also increase the scope for aggressive accounting as costs and liabilities can be bundled up into the purchase price and kept away from the income statement. The costs of integrating acquired businesses are treated as one-off or exceptional items but the future cost savings that come from them boost future underlying profits.
Exceptional items are often abused by companies and many investors and analysts just seem to ignore them (which is what the company wants them to do). In my experience, exceptional items can become regular expenses that occur every year and are not one-off costs. Companies which tend to abuse the use of exceptional items can often be very poor investments.
When you come across an acquisitive company you need to try and answer some very important questions such as:
- Is the underlying business still growing?
- Are the acquisitions increasing or decreasing a company’s return on capital (ROCE)? Put another way, is the company spending its money wisely?
- Is there any sign of aggressive accounting?
- Are the acquisitions putting a strain on the company’s finances?
Let’s take a look and see how RPC stands up to this kind of questioning.
Underlying organic growth
Here, I am looking at underlying sales growth which is the lifeblood of any business. I’ll talk more about profits shortly.
The core packaging business saw 3% like-for-like sales growth in 2016/17.
| Market | Sales (£m) | % of total | LFL growth (%) |
|---|---|---|---|
| Food | 755 | 31.9% | 5.0 |
| Non-food | 632 | 26.7% | 4.0 |
| Personal Care | 401 | 17.0% | 0.0 |
| Beverage | 383 | 16.2% | 0.0 |
| Healthcare | 130 | 5.5% | -1.0 |
| Other | 64 | 2.7% | |
| Total | 2365 | 100.0% | 3.0 |
The dominant food and non-food sales of this business did well but personal care, beverages and healthcare made no progress.
The non-packaging business fared a little bit better with LFL sales growth of 4% boosted by strong automotive and moulded tool sales.
Since the company embarked on its ‘Vision 2020’ strategy in 2013 the average rate of organic sales growth has been 3.2%. So the underlying business has been growing – which is positive – but not by very much.
Impact on ROCE
RPC’s capital employed has increased dramatically since 2013 but its profits have not increased as quickly. Consequently, its lease-adjusted ROCE has declined and is now below 10%.
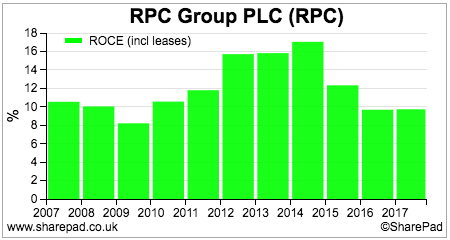
A closer look under the bonnet can explain what has been going on. One of the most revealing forms of financial analysis is to look at a company’s performance over a number of years and look at cumulative changes rather than changes from year to year.
So if you want to look at what’s been happening to RPC’s ROCE between 2013 and 2017 you just take away the specific numbers reported in 2013 from those in 2017 to get the cumulative changes. This can be quickly done in a custom financial table in SharePad and then exported to a spreadsheet for a few further calculations as shown below:
| Year (£m) | 2013 | 2017 | Change |
|---|---|---|---|
| Turnover | 982.3 | 2747.2 | 1764.9 |
| Norm EBIT | 97.5 | 289.1 | 191.6 |
| Capital employed | 585.8 | 3752.3 | 3166.5 |
| EBIT margin | 9.9% | 10.5% | |
| Cumulative Turnover | 1764.9 | ||
| Cumulative EBIT | 191.6 | ||
| Cumulative Capital employed | 3166.5 | ||
| Cumulative ROCE | 6.1% | ||
| Cumulative margin | 10.9% |
Here we can see that RPC’s capital employed (I’ve excluded the impact of leases to keep things relatively simple and just look at the extra cash spent) has increased by a whopping £3.2bn with profits increasing by £191.6m – an incremental ROCE of just 6%. RPC ignores the amortisation of acquired intangibles and has stated that the cumulative increase in profits has been £216m – an incremental ROCE of 6.8%.
Profit margins have improved as the cost savings from integrating businesses have flowed through but RPC’s incremental returns can only be described as disappointing.
Any signs of aggressive accounting?
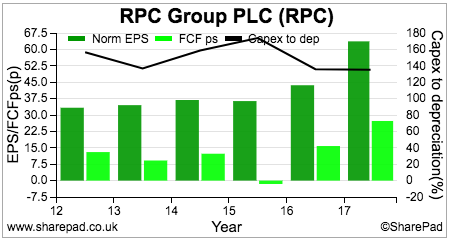
One of the first checks of profit quality is to see how good a company is at turning its underlying (normalised or adjusted) earnings per share into free cash flow per share. As you can see, RPCs cash conversion has not been too impressive recently but capex (investment in new fixed assets) has been relatively high and can explain some of this.
In more need of closer inspection is the very large amount of exceptional and non-underlying items that RPC has excluded from its own calculation of underlying operating profit. These are shown in a screenshot from the company’s latest annual report.
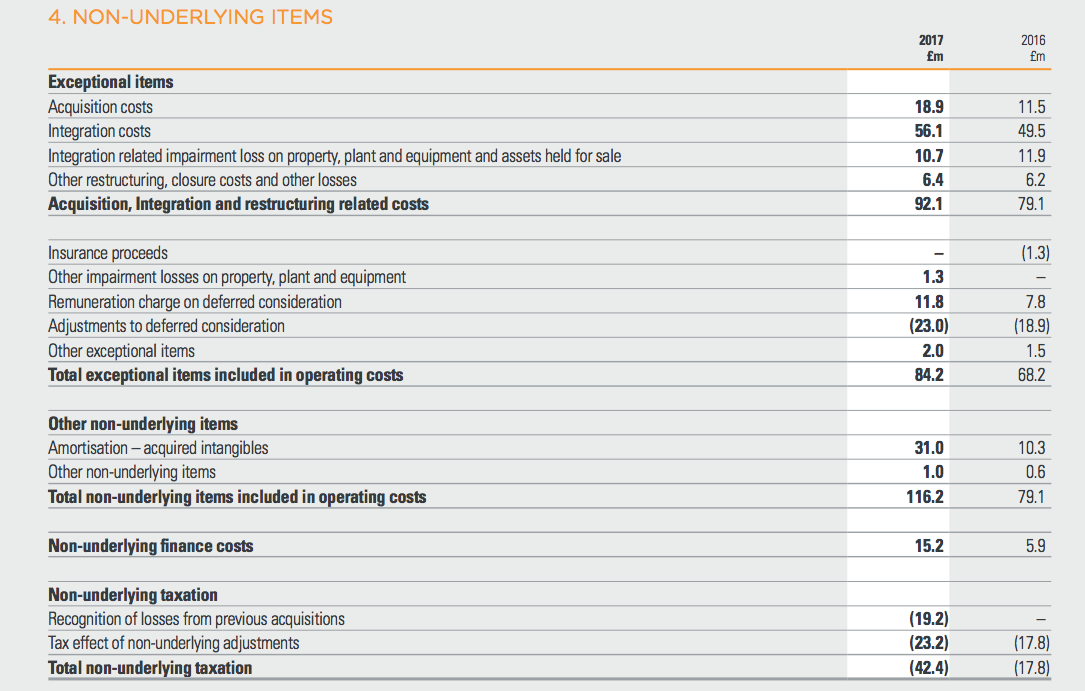
RPC has excluded £116.2m of costs from its calculation of £308m of underlying operating profit. This equates to 37.7% of underlying profits and to me seems like a huge number. In 2016, the comparisons were £79.1m and £174.3m or 45.4% of underlying profits – even bigger. You can see that this kind of magnitude has been commonplace for the last few years.
| Year | Underlying EBIT (£m) | Operating exceptionals (£m) | % of EBIT |
|---|---|---|---|
| 2017 | 308 | 116.2 | 37.73% |
| 2016 | 174.3 | 79.1 | 45.38% |
| 2015 | 131.6 | 48.4 | 36.78% |
| 2014 | 101 | 28.1 | 27.82% |
| 2013 | 89.7 | 36 | 40.13% |
I don’t think I can remember coming across anything like this before and must admit to being quite shocked. But does this mean that something dodgy is going on at RPC?
I have no idea as these large costs could be legitimate but if I was a shareholder in this business I would be asking the management to explain them in detail to me. Acquisition costs, integration costs and other restructuring costs total £81.5m and the vast majority of these will end up as cash flowing out of the company and a reduction in company value.
Removing the amortisation cost of acquired intangible assets – things such as brands, intellectual property and customer contacts – from underlying profits is worthy of a separate article. I know some investors and analysts who argue that they can be ignored.
I understand this, but also have some sympathy with the view that brands and other intangibles may require some money spending on them to maintain their value. Our data provider does not exclude them from its calculation of underlying (normalised) profits.
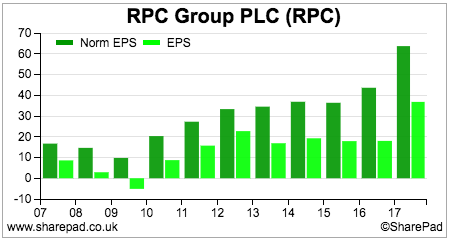
The large recurring exceptional items mean that there is a consistently big difference between underlying EPS (which ignores them) and reported EPS (which doesn’t). I never like to see this with any company and need to see a very good explanation to justify it.
One of the other calculations I often do is an estimate of cash operating profits (operating cash flow less depreciation and amortisation) and compare it with underlying operating profits. Here you can see that there is a significant gap between the two numbers.
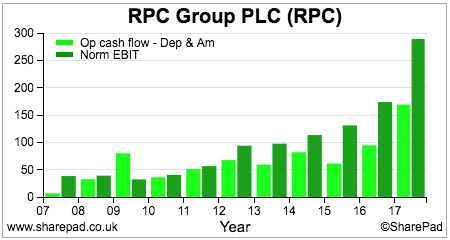
Normal changes in working capital outflows – by this I mean changes in line with sales growth – are fine but cash exceptional costs are a real reduction in value. With acquisitive companies such as RPC these have been both significant and regular in recent years.
The Beneish M-Score is a formula which tries to get an indication as to whether a company might be manipulating its profits. An M-score of greater (less negative) than minus 2.22 suggests that there may be something untoward. The current score for RPC is -1.85.
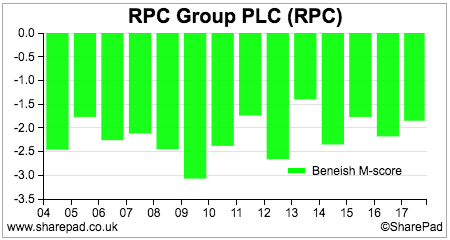
I think that there is a lot going on within the accounts of RPC but cannot definitely say that anything irregular is happening. I do see some red flags, particularly with the issue of large exceptional items. It will take many further hours of studying the accounts for an investor to reassure themselves in my opinion.
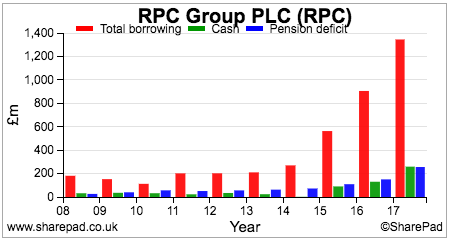
Has the acquisition spree weakened the financial position of the company?
In short, no. Fixed charge cover is over 7 times at the moment.
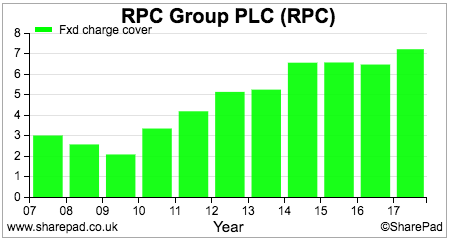
However, it is important to note that packaging sales and profits are quite sensitive to changes in the general economic climate. Debt levels have increased significantly and it could mean that if the company is to continue with its current buying strategy then further issues of equity cannot be ruled out.
Future prospects and valuation
RPC is expected to deliver modest rates of earnings growth over the next few years. This will come mainly from the full year effects of recent acquisitions, and the cost savings from integrating them, along with some underlying sales growth.
There are a number of risks to future profits. Firstly, the benefit to the value of overseas profits from the devaluation of the pound are likely to wear off. There is also a limited life to cost savings from acquired businesses.
Just over a third of RPC’s operating costs are explained by polymer costs which will have a strong relationship to the oil price. RPC’s increased size has improved its buying power, but if polymer prices do increase there will be around a three month lag before it can recover any cost increases from customers which may suppress profits.
The plastics industry is still subject to some overcapacity which means that there is a risk of prices coming under pressure as that capacity seeks orders. This is a main reason for RPC being an acquirer of companies as it helps to take capacity out of the market.

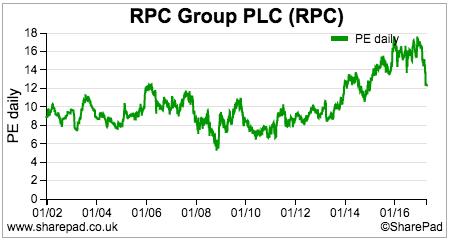
Given the issues regarding organic growth, the reliance on acquisitions and worries about further equity issuance it is not really surprising to see RPC shares on an undemanding forward PE multiple of 11.2 times. History suggests that this business has rarely commanded a high PE multiple for very long.

The company has a fantastic track record of dividend growth having increased its payout for 24 years in a row. Dividend cover is targeted at 2.5 times over the economic cycle which suggests that future dividend growth should track expected earnings growth.
This article is for educational purposes only. It is not a recommendation to buy or sell shares or other investments. Do your own research before buying or selling any investment or seek professional financial advice.


