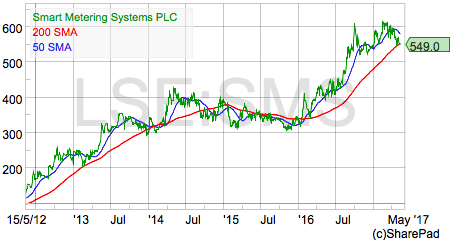
I recently wrote about Smart Metering Systems in my exclusive weekly newsletter for SharePad and ShareScope customers. It’s an interesting company so I have decided to dedicate a Stock Watch to it.
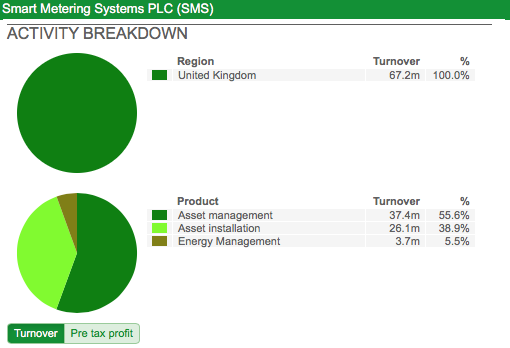
Smart Metering Systems (SMS) has been in business since 1995. The company’s roots were established following the deregulation of the domestic gas meter market. Today the company makes its money from three different sources:
- Installing gas and electricity meters for business and household customers.
- Managing gas and electricity meter assets for energy suppliers. Here the company receives rent from customers for the use of the meter and for providing them with data from it over the life of the meter. Meters can have working lives of up to 25 years which means that the rent could be extremely valuable – more on this later.
- Energy Management – helping businesses to reduce their energy consumption and carbon footprint.
The breakdown of the company’s revenues is shown in the chart below from SharePad.
SMS shares have been on a storming run over the last 18 months as the company has continued to grow and investors have warmed to its future prospects. Let’s see what’s been going on and what the future might bring.
Financial Performance
SMS looks to be a reasonable business as it is earning decent returns on capital employed (ROCE).
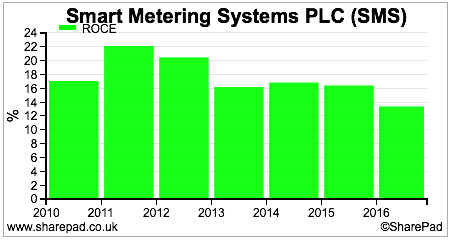
ROCE has been reasonably consistent in recent years but trended down in 2016. This can be attributed to a couple of reasons:
- The increased asset intensity of the business as more money was invested in new gas and electricity meters.
- The acquisition of new companies into the group. Two of these were previous subcontractors for SMS in installing meters. They are currently loss-making and contributed £2.3m of losses in 2016 whilst the money spent on acquiring them was added to capital employed.
The nature of SMS’s business is that it is very capital-intensive. The company buys new gas and electricity meters which at the current rate of installations is seeing significant cash outflows from capital expenditure. This means that SMS’s recent record of turning its profits into free cash flow is not very good. In fact, the picture is pretty horrible as shown below.
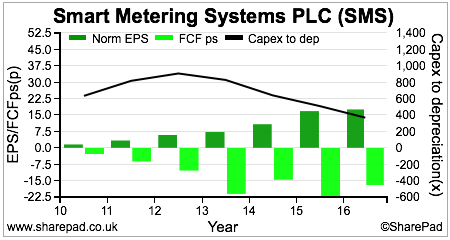
However, this does not mean that SMS is a bad business or it is manipulating its profits. In fact, it could be a sign that it is a business that could be building a significant amount of value for its shareholders. (Check out Looking beyond free cash flow to see why companies with low or negative free cash flow can actually be very good investment candidates.)
Negative free cash flow can be very positive as long as it is invested in decent ROCE projects and that it does not put too much of a strain on the company’s finances. We know from the ROCE chart above that the high rates of capex are still producing a decent ROCE.
Let’s now take a look at the company’s financial position.
We can see that borrowing levels have been increasing quite significantly in recent years as a result of the company’s heavy levels of investment and negative free cash flows.
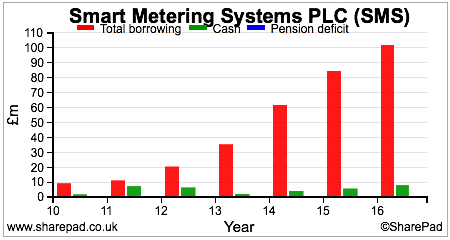
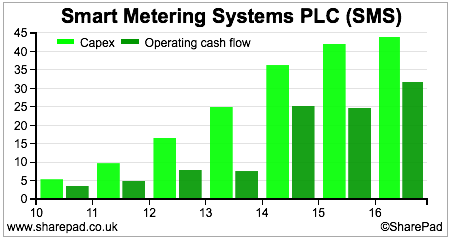
However, the company does not look to be suffering any kind of financial distress. This is because the higher levels of capex are producing higher levels of operating cash flow.
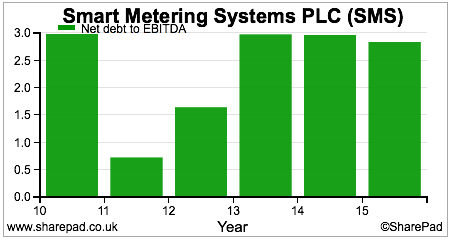
If we look at common measures of a company’s debt load then it is safe to say that SMS is comfortably financed. Net debt to EBITDA is less than 3 times. This is fine for a company with reasonably predictable revenue streams in the form of rents from meter assets.
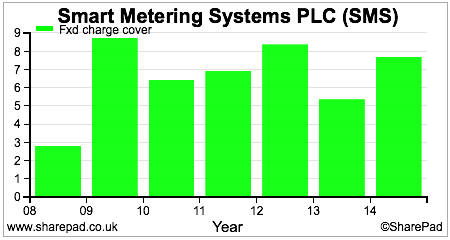
If we then look at fixed charge cover which measures how many times a company’s profits can cover its interest payments on its debts and other fixed charges such as rents, then the company’s finances look absolutely fine at the moment – quite strong in fact.
How SMS is building value for shareholders
As to whether SMS shares are a decent investment today largely depends on its meter asset management business. The rental stream from these assets does not have a high level of cash costs expensed against it which makes them extremely profitable as shown in the table below.
| SMS Asset Management (£’000) | 2016 | 2015 |
|---|---|---|
| Revenue | 37,359 | 30,233 |
| Cost of sales | -14,441 | -10,526 |
| Gross profit | 22,918 | 19,707 |
| Amortisation | -1,991 | -121 |
| Operating profit (EBIT) | 20,927 | 19,586 |
| Margin | 56.00% | 64.80% |
| Depreciation | 9,235 | 6,378 |
| EBITD | 30,162 | 25,964 |
| margin | 80.70% | 85.90% |
Depreciation on the capital costs of meters used to be disclosed as a separate expense item but is now included in cost of sales. My general view is that depreciation is a real expense but this is only true if the asset is going to be replaced.
In this instance, I’ve added back depreciation to profits to get an insight of how much trading cash flow SMS’s portfolio of meter assets is currently producing. Amortisation includes costs for software, development and customer contracts which I’ve left treated as an expense.
So you can see that meter assets producing £37.36m of revenue in 2016 converted into £30.16m of operating cash flow. If these meter assets have a long remaining life then these cash flows could be extremely valuable.
Why do I say this?
Well, the rental contracts with energy suppliers are linked to changes in the retail prices index (RPI). This makes them effectively a kind of index-linked bond. This is the kind of income stream that investors are currently prepared to pay a lot of money for (as evidenced by low and negative yields on some index-linked bonds at the moment).
If I take the current EBIT of £20.927m, tax it at 20% and then add back the depreciation expense of £9.23m then I get an estimate of £26m of free cash flow before interest for the portfolio of meters. The average remaining life of the meters determines the potential value of this income stream.
What I’ve done in the table below is try to estimate how much £26m of free cash flow in real terms (not adjusted for inflation) would be worth today if it lasted for varying lengths of time at different real interest rates (the amount added on top of inflation). I’ll explain how you do this in a spreadsheet at the end of the article.
Value of £26m of free cash flow at different interest rates for different lengths of time
| £26m | 10 years | 15 years | 20 years |
|---|---|---|---|
| 2% | £234m | £334m | £425m |
| 3% | £222m | £310m | £387m |
| 4% | £211m | £289m | £353m |
| 5% | £201m | £270m | £324m |
| 6% | £191m | £253m | £298m |
| 7% | £183m | £237m | £275m |
| 8% | £174m | £223m | £255m |
| 9% | £167m | £210m | £237m |
Current real interest rates on UK government bonds are negative (less than inflation) but income streams from gas and electricity meters are more risky than interest payments on government bonds. This is because energy customers can cancel the rental contract with SMS at any time by paying a penalty fee. Presumably, this happens when a household or business changes supplier. SMS would then have to find another customer for the meter.
To compensate for this risk, investors should demand a higher interest rate. Depending on how long the average remaining life of the meter portfolio is and the real interest rate chosen, then I can get a range in enterprise (or asset) value for SMS’s meter asset management business of between £167m and £425m today based on its existing assets. This compares with an enterprise value for the whole of SMS of £589m at a share price of 555p.
The value of future growth
In most cases, investors look forward and try and work out what the future profits and value of a company might be. With SMS, this will depend on the number of meter assets it has installed and is receiving rental income from.
The company has a good track record of growing its meter assets and the annualised level of rental income from them.
| Year | No of Meters | Annualised income (£m) | Income per meter |
|---|---|---|---|
| 2011 | 254,000 | £6.6m | £25.98 |
| 2012 | 341,000 | £9.3m | £27.27 |
| 2013 | 469,000 | £18.3m | £39.02 |
| 2014 | 769,000 | £26.2m | £34.07 |
| 2015 | 979,000 | £34.7m | £35.44 |
| 2016 | 1,251,000 | £41.3m | £33.01 |
As you can see, the number of meters has grown nicely over the last few years and so has the amount of annualised income from them.
The table below shows SMS’s meter portfolio in more detail with the income from different types of meter contracts in 2016. We can see that meters are earning around £35-£37 a year in rent and data pays around £23-£24 per year.
| Product | No of Meters | Recurring rent | Rent per meter |
|---|---|---|---|
| Gas meter | 881,000 | £31.5m | £35.75 |
| Gas data | 108,000 | £2.6m | £24.07 |
| Electricity meter | 77,000 | £2.9m | £37.66 |
| Electricity data | 186,000 | £4.3m | £23.12 |
To put this rental stream into context the total amount of cash spent on meters by SMS at the end of 2016 was £180.7m (taken from the property, plant & equipment note in the 2016 accounts) which equates to an average cost of £144 per meter. An annualised rental income of £41.7m gives an effective rental yield of 23.1% whilst the current free cash flow of £26m would pay back the cost in 7 years.
These meters are clearly very profitable. If SMS can keep on growing the size of its meter portfolio then the value of the company looks set to increase. The question is, how is it going to go about doing this?
The key source of growth is the rollout of smart meters for domestic gas and electricity customers in the UK. This rollout has had teething troubles and is behind schedule. The government wants every household to have smart meters by 2020. This is not going to happen in my view as only around 5 million have been installed leaving a backlog of around 45 million. SMS is talking about an installation period of around 5 years.
The company is in a good position to grow. It has signed contracts to install smart meters with energy suppliers who currently supply 2.5 million customers. SMS has also bought two of its previous sub-contractors and therefore has taken control of the installation process in house. Its weekly installation capacity has increased from 20,000 to 40,000 which gives it a significant competitive edge over its rivals in terms of capability and managing service quality. SMS also has a scalable IT platform to manage this growth and can handle 5 million meter accounts without further cash investment.
SMS has stated that it wishes to gain a 15% market share of the 48m domestic smart meter market. This would equate to a portfolio of 7.2 million meters. If it could get to that position within the next five years then you can build a very favourable investment case for the shares.
Keeping the maths deliberately simple, if the annual revenue per meter was £35 and the EBITD margin stayed around 80% then SMS would have annual revenues of £259m with a pre-interest and pre-tax cash flow of £209m. This is based on the assumption of 7.2 million domestic smart meters and 200,000 industrial and commercial accounts.
Free cash flow would be an estimated £169m assuming a tax rate of 20% (even though corporation tax rates are expected to fall). Assuming a real, pre-inflation interest rate of 5% then the estimated value of the rental stream from such a portfolio of meters would be nearly £1.8bn.
Estimated value of 7.4m smart meter portfolio
| 2016 | 2026F | |
|---|---|---|
| No of Meters | 1.2m | 7.4m |
| Revenue | £41.2m | £259.0m |
| Revenue per meter | £33 | £35 |
| EBIT margin | 56% | 56% |
| EBIT | £23.1m | £145.0m |
| Cost per meter | £144 | £144 |
| Depreciation per meter over 20 years | £7.20 | £7.20 |
| Depreciation | £9.2m | £53.3m |
| EBITD | £32.3m | £198.3m |
| EBIT less tax @ 20% | £18.5m | £116.0m |
| FCF | £27.7m | £169.3m |
| Total cash invested | £180.7m | £1,065.6m |
| Value if 15 years remaining at 5% | £287.4m | £1,757.4m |
However, as with most things in investing there is no free lunch. Assuming a cost of £144 per meter, in order to grow the meter portfolio by nearly 6.2million is going to cost a lot of money. If my rough and ready calculations are in the right ballpark then SMS is going to have to find an extra £800m to meet its aspirations.
Assuming a current installation capacity of 40,000 per month or around 0.5 million per year without using sub-contractors an organic roll out would cost just under £75m a year in capex over ten years. clearly the capex costs could be much higher than this if the government’s installation target is met over 5 years
This would mean that free cash flow would continue to be significantly negative for many years ahead. Current net borrowings are £94.2m and the company has a banking facility if £280m which means that SMS does not have a funding issue at the moment.
With growing operating cash flows, an increase in its borrowing limits is not an unreasonable assumption. Neither is an issue of equity, perhaps with a rights issue to existing shareholders.
Rights issues are widely misunderstood with even professional analysts sometimes saying that they dilute shareholders ownership. Rights issues are not dilutive to shareholders who take up their rights. If the company is using the money raised to invest in high-returning assets – as SMS would be – then shareholders have nothing to fear in my opinion. But my guess is that any talks of a rights issue at SMS may still cause the share price to wobble.
Are the installation and energy management divisions worth much?
Most of the value of SMS rests with its meter portfolio and the rents which come from it. The installation business does make a gross profit and should have increased levels of activity for the next few years which should see that grow. The Energy Management division is making very modest profits in the context of the overall company.
The reason why I question the value of these two businesses is that SMS has significant unallocated costs which offset the profit contribution from them.
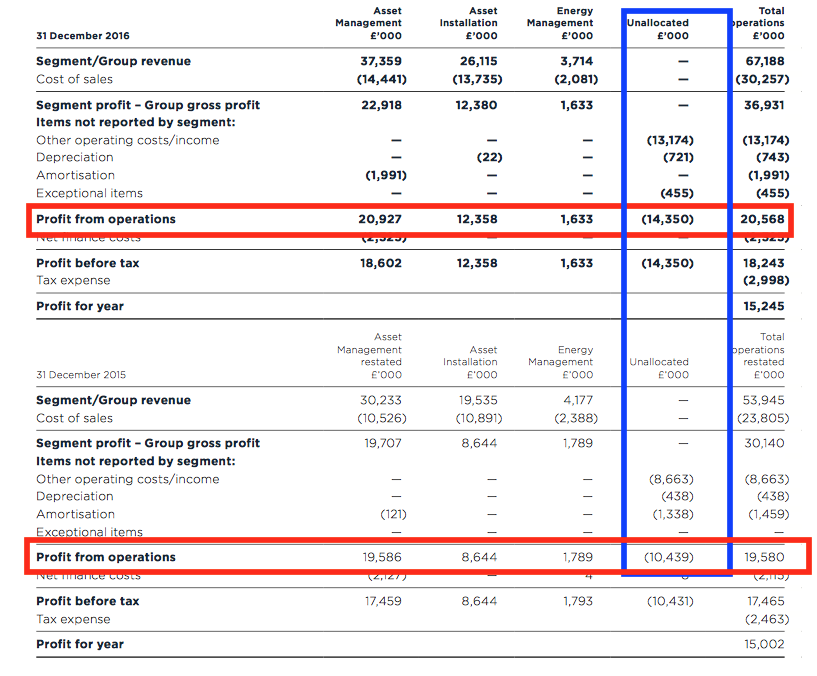
As you can see from the segmental split of profitability, a very large unallocated cost number has offset the profit contributions from Asset Installation and Energy Management in both 2015 and 2016. The group’s overall operating profit has essentially been the same as the operating profit from the Asset Management business.
Whether this will continue remains to be seen. I see the Asset Installation business as a cog in the Asset Management business – a way of winning meter rental contracts – rather than a significant separate source of value.
Valuation and outlook
I see potential for SMS to create significant future value for its shareholders. That said, a large chunk of that potential is arguably already reflected in the current share price as evidenced by its high forecast PE ratio.
img src=”https://sharescope.co.uk/images/philoakley152_10.png” />
The shares also come with a reasonable degree of risk attached to them. The smart meter roll out has been slow and is attracting a certain amount of negative press coverage. Commonly cited issues are inaccurate meter readings and the increased difficulty in changing energy suppliers due to the incompatibility of different types of smart meter. Some are sceptical as to whether the huge cost of the roll out will bring much in the way of energy savings to customers.
At the moment, the current government is committed to the programme. However, if there was a change of mind and the plug was pulled then it would be very bad news for SMS. This is a risk, but a very small one at the moment.
Appendix: How to value an annuity stream in a spreadsheet
This is a great way of valuing anything with a constant profit or cash flow. It’s very useful for valuing companies with contracts. I used this formula a lot when I was a professional analyst to value businesses such as rail franchises which had a finite life. You can also use it to value bonds.
I have used Apple’s Numbers spreadsheet to do this but the same function can be used in Excel or Google Sheets.
To get a value you need three pieces of information:
- The annual profit or cash flow
- The number of periods the cash flow will occur – usually in years.
- A discount rate or interest rate.
| Annual cash flow | Contract length (years) | Interest rate |
|---|---|---|
| 10 | 15 | 7% |
| Value of contract | £91m |
Here’s how you value a 15 year contract with £10m of annual cash flows at an interest rate of 7%.


You take the PV formula from the financial functions list. Put a minus sign in front of it or else you will get a negative number as your answer.
- The periodic rate is 7% or cell C2
- The number of periods if 15 or cell B2
- The payment is 10 or cell A2
- The future-value and when-due inputs can be left blank.
- The present value of the contract is £91m.
This article is for educational purposes only. It is not a recommendation to buy or sell shares or other investments. Do your own research before buying or selling any investment or seek professional financial advice.


