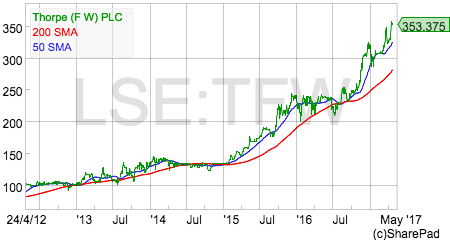
FW Thorpe was founded in 1936 and has been listed on the stock exchange since 1965. The company designs and manufactures professional lighting systems for commercial markets. It has been very successful in carving out a profitable niche for itself and its shares have proven to be a very decent long term investment.
What makes this company particularly interesting is that very few City analysts research it. There are no published profit forecasts for investors to base their decisions on. This makes FW Thorpe the kind of company where the diligent private investor can perhaps get an edge as it is unlikely to be on many investor’s radar screens.
The business
The company is dominated by Thorlux, its commercial and industrial lighting business which accounts for around three quarters of its overall profits. The rest of the group is made up of a number of autonomous lighting companies which specialise in niche areas of the lighting market. The breakdown of FW Thorpe’s 2016 sales is shown in the table below.
| Company | Sales (£m) | Business |
|---|---|---|
| Thorlux | 57 | Commercial & industrial lighting |
| Compact | 3.9 | Retail lighting |
| Philip Payne | 2.5 | Emergency exit signs |
| Portland | 3.5 | Illuminated signs for shop fronts and advertising billboards |
| Solite | 2.6 | Clean room lighting e.g. laboratories & kitchens |
| TRT | 8.3 | Street, road & tunnel lighting |
| Lightronics | 15.6 | Street lighting in Holland |
| Luxintec (40% share) | LED lenses for emergency vehicles in Spain |
With the exception of the Dutch and Spanish businesses, all the manufacturing is done at UK sites but the company has sales offices in Ireland, Germany, Australia and the Middle East.
The company has grown steadily over the last few years and has been buying lighting companies in new markets and countries. It also has a good track record of innovating and bringing new products to market which increase sales and profits.
Historic financial performance
The company has consistently made high returns on capital employed (ROCE) which is a hallmark of a high quality business. However, those returns have been steadily falling since peaking in 2008, although the last couple of years has seen ROCE begin to tick up again.
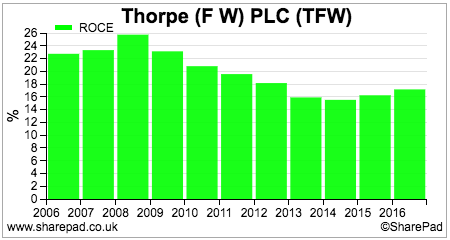
The business has been very resilient over economic cycles – profits increased during the 2008/09 recession – but occasionally it does have an indifferent year such as in 2013. This was when there was a lull in orders at Thorlux which recovered in the following year.
If we take a closer look at how FW Thorpe makes its high returns, we can see that its ROCE has been underpinned by high profit margins.
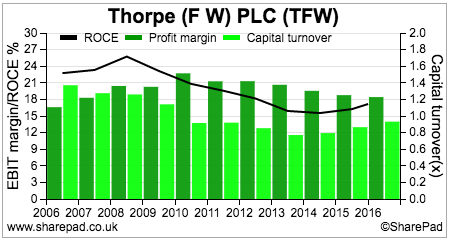
Consistently high profit margins are generally an attractive characteristic for a company. They tell the investor that the company may have been successful in warding off competitors. High margins also offer some protection against temporary setbacks. For instance, a company with high profit margins can withstand a reduction in profitability a lot better than one with very low profit margins.
However, FW Thorpe’s profit margins have been falling. Is this something that investors should be worried about?
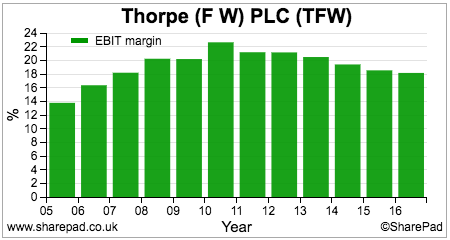
I don’t think so.
FW Thorpe Financial Performance (£’000s)
| Revenue | 2011 | 2012 | 2013 | 2014 | 2015 | 2016 | TTM |
|---|---|---|---|---|---|---|---|
| Thorlux | 44054 | 44949 | 45298 | 50307 | 56521 | 56566 | 62126 |
| Lightronics | 3275 | 15584 | 18403 | ||||
| Other | 9543 | 11197 | 10697 | 14436 | 17858 | 21666 | 25052 |
| Adjustments | -764 | -587 | -663 | -1796 | -4110 | -4870 | -6769 |
| Total | 52833 | 55559 | 55332 | 62947 | 73544 | 88946 | 98812 |
| EBIT | |||||||
| Thorlux | 10407 | 10740 | 10239 | 10593 | 11267 | 11699 | 12466 |
| Lightronics | 481 | 2103 | 2504 | ||||
| Other | 649 | 828 | 317 | 942 | 1944 | 2189 | 2381 |
| Adjustments | 196 | 282 | 194 | 26 | 204 | 125 | |
| Total | 11252 | 11850 | 10750 | 11535 | 13718 | 16195 | 17476 |
| Margins | |||||||
| Thorlux | 23.62% | 23.89% | 22.60% | 21.06% | 19.93% | 20.68% | 20.07% |
| Lightronics | 14.69% | 13.49% | 13.61% | ||||
| Other | 6.80% | 7.39% | 2.96% | 6.53% | 10.89% | 10.10% | 9.50% |
| Total | 21.30% | 21.33% | 19.43% | 18.32% | 18.65% | 18.21% | 17.69% |
Thorlux’s margins have come down slightly but the company has given a plausible explanation for this. A buoyant order book has seen temporary higher wage costs in the form of overtime and shift working which is unlikely to persist.
There is also a level of inefficiency in Thorlux’s manufacturing process. Whilst LED lighting has been a growing part of sales, it still has to produce traditional forms of lighting (such as fluorescent) where the cost of production is greater than that for LED. This is a drag on profit margins but should be offset by the introduction of new, more efficient products and a gradual phasing out of old lighting technologies.
The other issue affecting the company’s operating margins is a change in revenue mix. The acquisition of the Dutch Lightronics business has introduced a chunk of revenue with lower margins than Thorlux which has diluted the company’s overall profit margins.
What is the company’s competitive edge?
When you come across a company with desirable financial performance measures such as high profit margins and a high ROCE, try and take some time to understand why. Crunching numbers is all well and good, but you will become a more informed and better investor if you try and get behind the numbers and identify the characteristics of a company which allow it to be as profitable as it is.
As far as FW Thorpe is concerned, I can see a few good reasons as to why the company has developed a competitive edge.
First and foremost, it is competing on quality rather than price. Lighting can be a heavily commoditised product dominated in low cost centres of production such as the Far East. A UK-based manufacturer is going to have a hard time making reasonable profits in this space.
So FW Thorpe has positioned itself as a seller of high quality lighting and lighting controls which bring a lot of incremental benefits to its customers such as:
- Saving energy
- Fewer lamp replacements
- Less maintenance
- Better lighting
- Customer service
FW Thorpe is essentially a lighting solutions provider which solves problems for its customers. This is what differentiates it from its more commoditised competitors.
Quality of profits
As you can see from the chart below, the company has a reasonable track record of turning its profits into free cash flow, but the cash conversion is typically less than 100%.
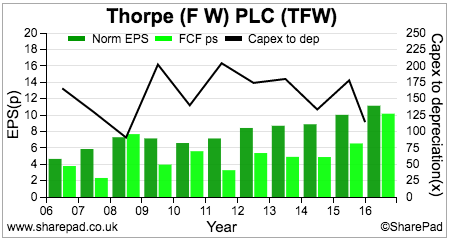
The black line shows that the company typically spends more on new assets (capex) than its depreciation charge each year. This can be explained by it adding more manufacturing capacity to grow the business and maintaining the condition of its existing assets.
On the face of things, FW Thorpe’s free cash flow performance is reasonable. It has enabled it to pay a rising dividend per share as well as a number of special dividends in recent years.
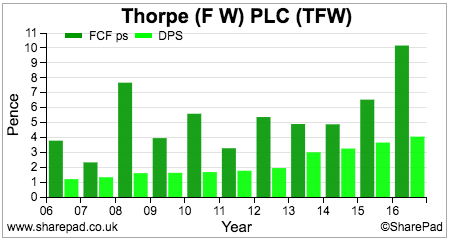
The chart above shows the company’s free cash dividend cover. There is usually a big buffer between free cash flow per share and the annual dividend per share. Based on its profits, the company pays out less than a third of its profits in dividends to shareholders every year. Perhaps the company has scope to offer shareholders a more generous dividend in the years ahead?
However, FW Thorpe is essentially a family-controlled business with chairman Andrew Thorpe and non-executive Ian Thorpe controlling 44% of the shares between them. These kind of companies can be very conservative which is a good thing in my opinion. I can understand why businesses want to be careful with their money and think that the payment of special dividends from time to time has been a reasonable policy.
Squeaky clean balance sheet
FW Thorpe’s conservatism is shown in its financial position. The company has no borrowings, a healthy cash balance and a final salary pension scheme which is currently in surplus.
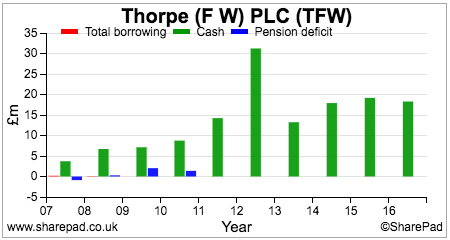
From a shareholder perspective, this is almost an ideal balance sheet. Manufacturing companies tend to have lots of operational (income) gearing due to the large fixed overheads of running plant and machinery. Adding debt and financial gearing on top of this is not wise and adds considerable risk to shareholders’ profits if trading turns down in a recession.
One ratio that is always worth paying attention to with a manufacturing company is the level of stock (sometimes called inventory) as a percentage of turnover. These companies need stocks of raw materials and parts to make their products as well as a sufficient supply of finished goods to meet customer orders.
Stock levels can be abused by manufacturers. The overhead costs (wages and other operating costs) incurred can be capitalised into the value of stocks and put on a company’s balance sheet rather than being expensed through the income statement.
One way of spotting a company that might be manipulating its profits is a sharp rise in the Stock to turnover ratio. This can come from overproduction of goods relative to the anticipated demand for them. A company can therefore inflate its profits by shifting operating expenses to the balance sheet and away from the income statement.
This may also be a sign of falling demand for its products which may require stock costs to be written down which would lead to lower profits in the future.
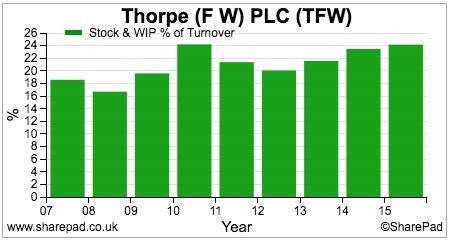
Stock to turnover ratios of around 20% are not unusual for manufacturers. That said, FW Thorpe’s has been increasing for the last three years. I don’t think there is anything untoward going on here but if you are an owner of this share – or interested in being one – then you might want to keep an eye on this.
Future prospects and valuation
Current trading is good – half year sales increased by 23.8% with trading profits growing by 19.7%. The interim dividend was increased by 12.5%.
The core Thorlux business is doing very well both in the UK and overseas. The TRT road, tunnel and street lighting business is also performing well and continuing its strong momentum following a record 2016. New capacity has just come on stream which has put this business on a good platform for growth.
The Philip Payne business, which sells specification exit signs (fire and emergency exits), Solite and Portland are also doing well.
New products also have the potential to produce further growth. The company’s Smartscan wireless lighting control system is apparently proving very popular with customers and looks set to continue FW Thorpe’s strong track record of introducing attractive and innovative new products.
There are a few areas of potential concern. The Compact Lighting business which makes lighting for retail outlets has been losing money. It is operating in an area where there is lots of competition and is selling into a declining sector of the economy. The company is trying to improve matters by merging product ranges and sales platforms with Thorlux. However, I would not be surprised to see this business closed or sold off in the future as FW Thorpe has a track record of getting out of underperforming businesses.
The Lightronics acquisition looks to be a good one. Trading here has been buoyant and the company, by its own admission, thinks it will be hard to replicate 2016’s stellar performance. That said, trailing twelve month EBIT was £2.5m compared with £2.1m for 2016 as a whole.
Lightronics was meant to provide a platform for FW Thorpe to build a significant presence for Thorlux and its other businesses in Holland and nearby markets. This has not progressed as quickly as the company had expected but that doesn’t mean that it will not happen eventually. The same issue can be cited with the company’s stake in Luxintec in Spain.
2017 should be a year of strong profits growth but this looks to be increasingly reflected in the company’s share price and valuation. At 354p, the shares trade on a very high 29.5 times trailing twelve months (TTM) EPS.
However, at 31st December 2016 there was £35.7m of cash on the balance sheet which equates to 30.1p per share if this is representative of the cash balance throughout the year. Cash balances inflate PE ratios. If this is adjusted for, FW Thorpe’s TTM PE falls to 27 times which is still pretty punchy. The shares are trading at historic highs on a rolling PE basis.
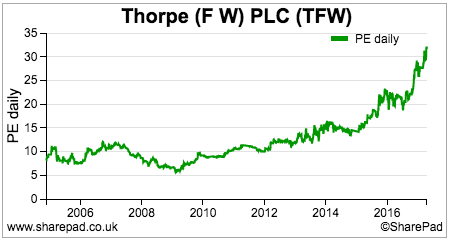
I think FW Thorpe deserves a high valuation given its high levels of profitability and current rates of growth. I’m not sure whether the valuation of its profits can command a much higher multiple than it currently has but continued strong profits growth could see long-term shareholders continue to make money from owning the shares. As always, when valuations are as high as this, there is little room for disappointment in terms of profit performance and growth.
This article is for educational purposes only. It is not a recommendation to buy or sell shares or other investments. Do your own research before buying or selling any investment or seek professional financial advice.


