A couple of weeks ago I wrote about the issues investors faced in working out a company’s true profits. In many cases, the ways in which companies calculate their so-called adjusted profits are becoming increasingly absurd. Investors are frequently asked to ignore certain real costs so that profits are as big as possible.
The harsh truth is that some companies are nowhere near as profitable as they would like people to think they are.
What really matters at the end of the day is how much cash flow a company is generating.
Talk to anyone who runs their own business about what really matters to them and the vast majority of them will say “cash flow”. This is also why the best investors spend more of their time looking at company cash flows rather than profits.
However, to the novice or inexperienced investor cash flow statements can seem quite daunting. This need not be the case. You just need to ask one simple question:
Does a company turn its profits into cash flow?
Generally speaking, good companies turn their profits into cash flow. Bad ones do not.
By looking at how a company turns its profits into cash it is possible to get a very good feel of whether its profits are believable or not. There are two ways of doing this.
- Compare a company’s operating profits with its operating cash flow – its operating cash conversion.
- Compare free cash flow with post tax profits or free cash flow per share with earnings per share (EPS) – its free cash conversion.
One possible way of identifying good long term investment candidates for your portfolio is finding companies that have both good operating and free cash conversion. It is generally easier for a company to have good operating cash conversion than free cash flow conversion as I will show.
You can find all the information you need to do this in a company’s cash flow statement or in the notes to its annual accounts. The information is also quickly available in SharePad.
Let’s take a look at a few examples.
Carillion’s very weak operating cash flow
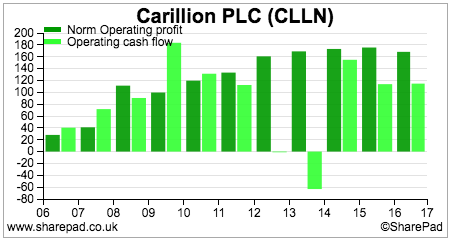
Hindsight is a wonderful thing, but comparing Carillion’s (LSE:CLLN) adjusted operating profits with its operating cash flow was a warning sign to investors that something wasn’t quite right with the company. As you can see from the chart below, the company had consistently failed to turn its profits into cash for a while.
If you take a closer look at Carillion’s operating cash flow in 2016 – its last reported annual results – you can see that there was plenty of evidence to suggest that this was a company in deep trouble.
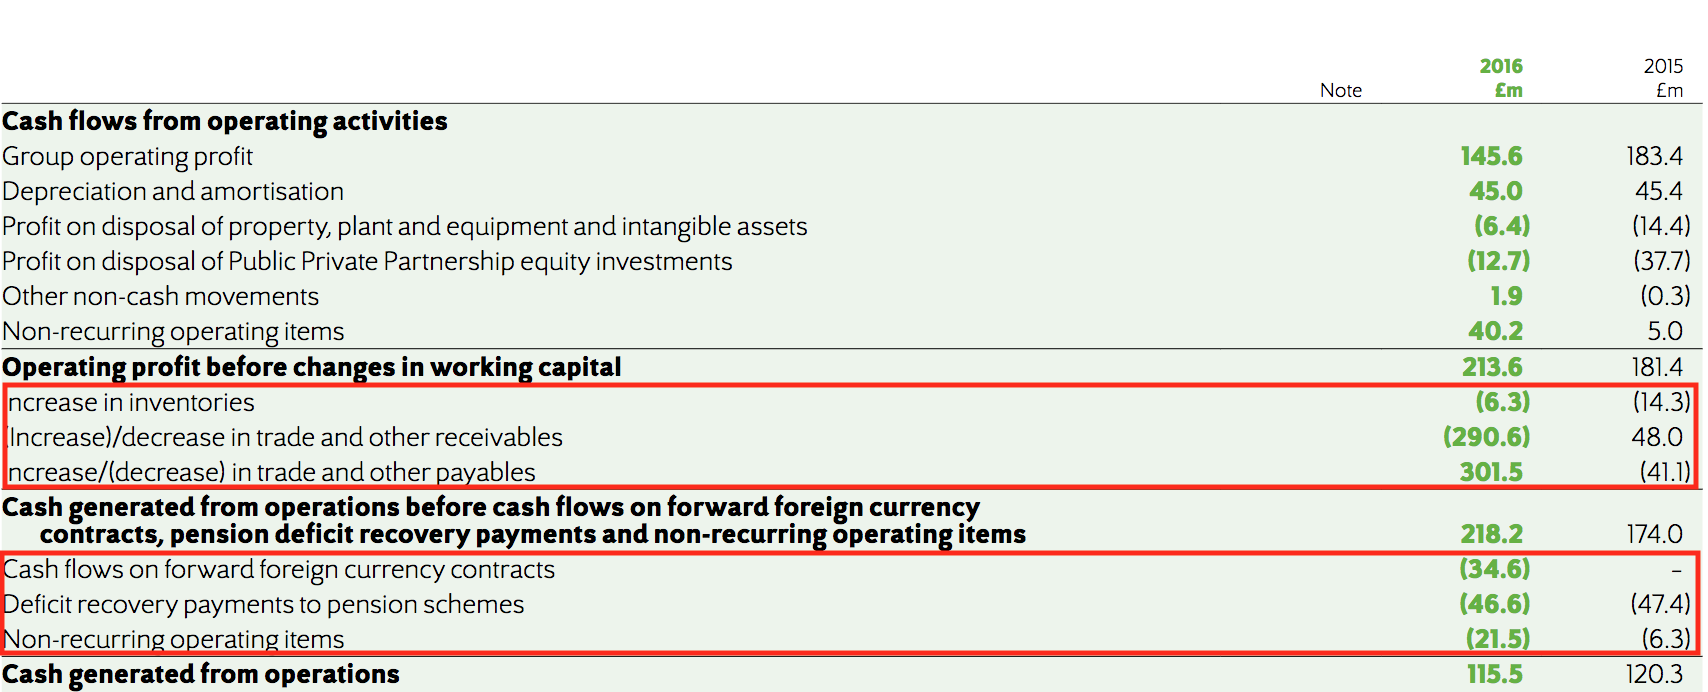
The company had a reported operating profit of £145.6m in 2016. However, when non-cash items are accounted for, it had an operating profit before changes in working capital of £213.6m compared with £181.4m the year before.
Then things became more interesting. There was a massive £290.6m cash outflow due to the increase in trade receivables – money that the company had booked as revenue but had not been paid for. This was offset by a huge £301.6m cash inflow by delaying payments to suppliers and other payables. Both these cash flows were huge numbers and should have raised suspicions that something strange was going on.
The obvious question is what would have happened if the company had not been able to offset the huge outflow with a huge inflow? Another one would be why was there no explanation of these huge numbers in the finance director’s annual review?
There were also cash outflows from extra payments into the pension scheme, foreign exchange contracts and non-recurring operating items. After all cash flows were taken into account, the company had operating cash flow of £115.9m compared with an adjusted operating profit (before joint ventures) of £199.6m in its income statement – an operating cash conversion ratio of just 58%.
If the depreciation and underlying amortisation (excluding amortisation of acquired intangibles) of £31.2m is then taken away from operating cash flow we can get an estimate of cash operating profit of £84.7m – less than half the underlying profit in the income statement.
If we add back the cash outflows on non-recurring items and foreign currency we still only get £140.8m. Some people might add back the extra cash paid into the pension scheme but I think that would be too generous. The pension scheme had a very big deficit that had to be plugged. These extra payments were set to continue for many years into the future and represented money that could not be paid to investors.
There were clearly enough grounds for suspicion with Carillion that would have led many cautious investors to steer clear of the shares.
High operating cash conversion may not be a sign of health
Some companies are very good at turning their operating profits into operating cash flows but that does not mean they are good businesses. Sainsbury’s has been able to have an operating cash conversion of consistently more than 100%.
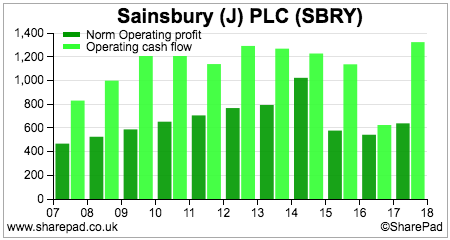
The reason for this is that the company has a very large non-cash depreciation expense which represents a very large proportion of its operating profits and operating cash flow. Supermarkets also tend to have negative working capital which produces cash inflows. This is because they typically sell their products for cash before they have to pay their suppliers.
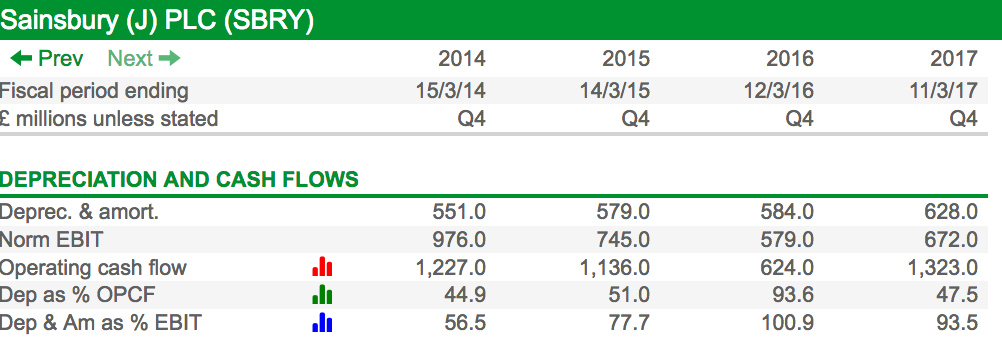
As you can see, depreciation has been a very high proportion of operating cash flow in recent years. Depreciation is a poor source of cash generation as in the case of supermarkets it is a real cost. Cash has to be spent on replacing assets – known as capital expenditure or capex – in order to maintain the revenues of the business.
If we look at free cash flow conversion which looks at cash flows after capex we can see that Sainsbury’s has been a very poor cash converter despite its operating cash conversion being more than 100%.
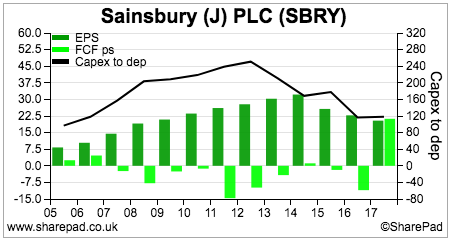
With the exception of 2017, which included over £600m of working capital inflows, Sainsbury’s free cash flow per share has been nowhere near its profits or earnings per share (EPS). This is because it has been spending more on capex than depreciation without meaningfully increasing its profits.
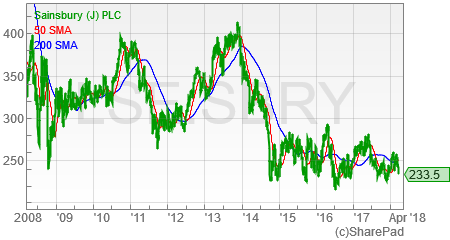
This helps to explain why Sainsbury’s shares have been a very poor investment and why its dividend has been cut.
Companies with good operating and free cash conversion
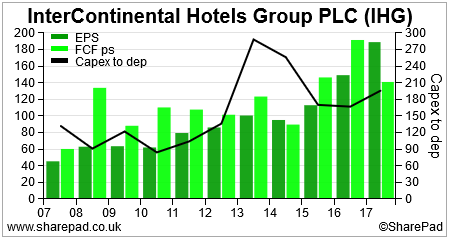
Companies that are able to grow their profits whilst converting them into cash can make very good investments. InterContinental Hotels (LSE:IHG) has been a very good example of this.
Operating cash flow has been consistently more than operating profit.
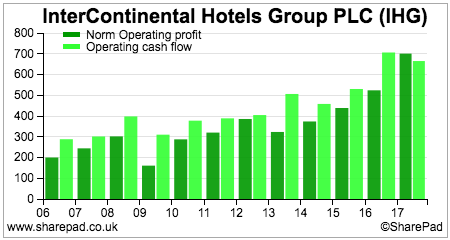
Free cash flow per share has been higher than EPS in most years.
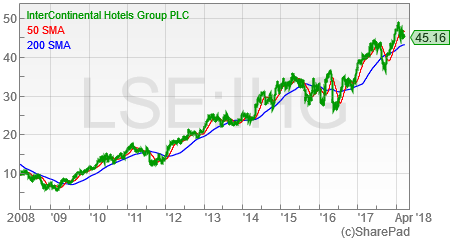
As you can see from its share price chart, it has been a very decent investment over the last decade.
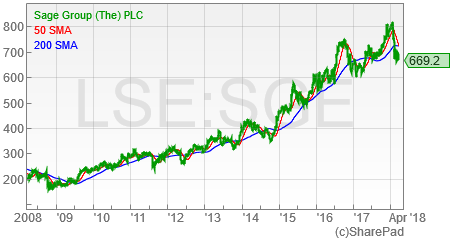
Another company that has scored well on both main measures of cash conversion has been accountancy software provider Sage (LSE:SGE).
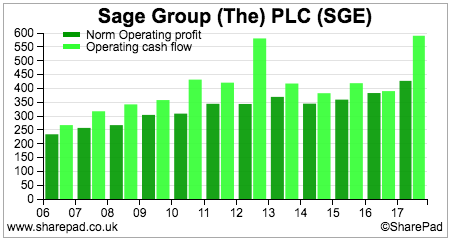
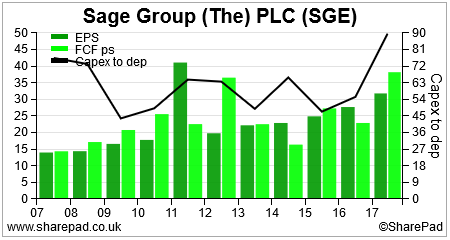
Its shares have also given very satisfactory long term returns to investors.
Are poor cash converters always poor investments?
No, they are not.
Companies that can grow their revenues and profits without having to spend lots of money on capex (new assets) are highly sought after. However, companies that can invest their cash flows and earn high rates of return on capital (ROCE) on them can also be very attractive even if their cash conversion is very poor.
A great example of this has been plant hire company Ashtead (LSE:AHT).
The only time this company tends to produce meaningful amounts of free cash flow is when there is a recession. It cuts back on investing in new bits of equipment which boosts free cash flow. When times are good it ploughs its cash flows into new equipment so that it can grow its profits and operating cash flows.
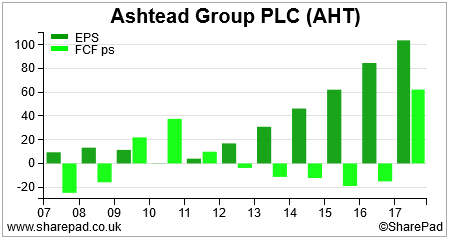
As you can see, free cash flow per share has come nowhere near to its EPS in recent times. In some years, free cash flow per share has even been negative.
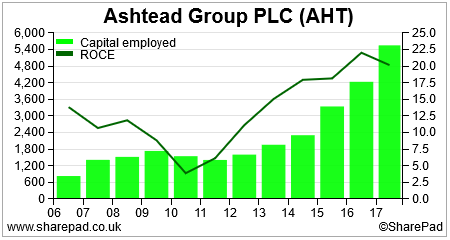
This is because there has been a huge increase in capital employed that has consumed cash flow. The good news is that all the extra money invested has been earning very high returns.
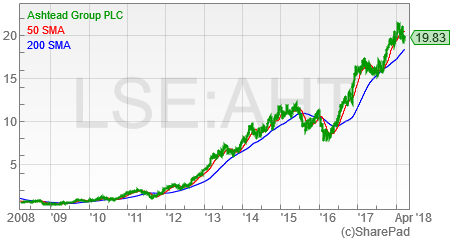
This has seen Ashtead’s profits grow rapidly and its share price go through the roof.
In many respects, Ashtead is the polar opposite of Sainsbury’s and shows why poor cash conversion isn’t always a bad thing.
Summary
- Consistently high conversion of operating profit into operating cash flow – high operating cash conversion – can be a sign of good quality profits (profits you can trust).
- Look at the trend of cash conversion over a number of years. In particular, look out for operating cash flows boosted by one-off working capital inflows. This usually cannot be maintained.
- Consistently high free cash conversion is the best sign of profit quality as it takes into account money spent on new assets (capex) and looks at the cash that can be paid to shareholders.
- Consistently poor cash conversion due to high capital expenditure is acceptable if the company is growing its profits and achieving high returns of capital employed (ROCE). Consistent ROCE of 15% or more is a sign of a high-quality company.
For a more detailed explanation of cash flow, read the following chapters in my Step-By-Step Guide to Investment Analysis: